
Learning objectives
- Describe the sampling methods:
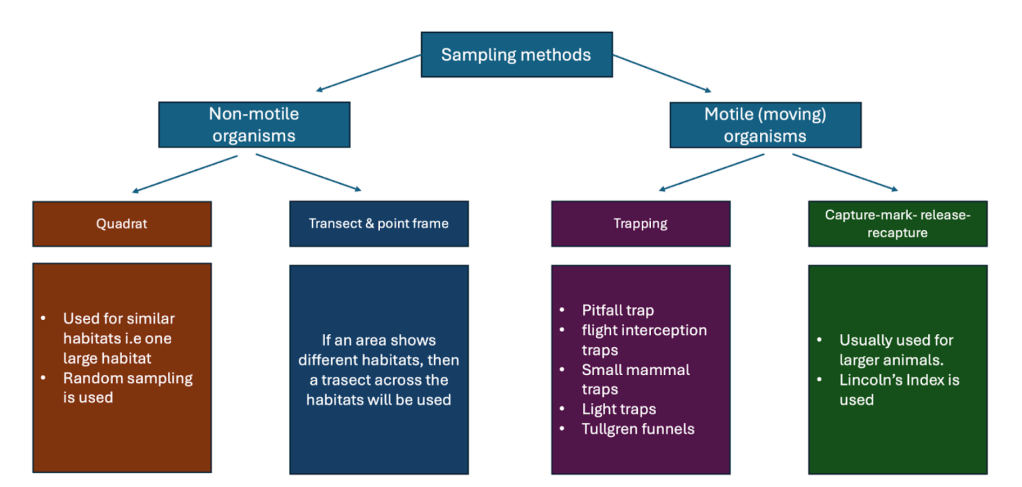
Part 1 Random Quadrat
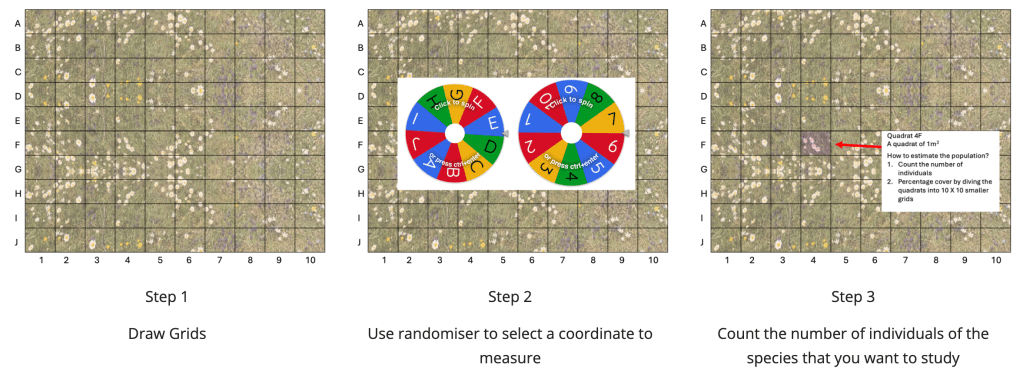
Process of Using Quadrats for Sampling Population Size
- Purpose: Quadrats are used to sample the population size of non-motile organisms to avoid repeated counting of mobile species.
- Size Selection:
- Quadrats typically range from 0.25 m² to 1 m².
- The correct size is determined by counting species in different quadrats and plotting species count against quadrat size.
- The optimal size is where the graph levels off, indicating no new species appear in larger quadrats.
Sampling Methods:
- Random Sampling (for uniform habitats)
- Mark out the habitat area using two tape measures at right angles.
- Use a random number generator to select quadrat locations.
- Convert random numbers into grid coordinates (e.g., a 10m × 10m grid with numbers between 0 and 1000).
- Place quadrats at coordinate intersections.
- Stratified Random Sampling (for varied habitats)
- Used when the sample area includes different habitat types (e.g., disturbed vs. undisturbed areas).
- Take separate sets of results from each habitat type for comparison.
- Systematic Sampling (for environmental gradients)
- Used when studying changes along a gradient (e.g., moisture levels, elevation).
- Place quadrats at fixed intervals (e.g., every 5m) along a transect line.
- Continuous sampling: Quadrat samples taken along the entire transect.
Population Density Calculation:

- Provides a standardized measure of species abundance in an area.
Abundance scales
- can be used to estimate the relative abundance of different organisms on, for example, a rocky shore.
- These are known as DAFOR scales
- Each letter indicates a different level of abundance:
- D = dominant, A = abundant, F = frequent, O = occasional and R = rare.
- Quadrats are usually used to define the sample area.
- Different types of species are put in different categories, for example seaweeds will be in a different group to periwinkles (periwinkles are a type of mollusc).
- These scales allow for general comparison between different sampling sites.
- It is a qualitative scale used to judge the abundance of different organisms. Because it is qualitative, it is subjective and so different people may have different judgements of abundance.
- Also, there are no distinctions between different species in the same category (e.g. all seaweeds will be treated alike, irrespective of size or other differences).
- The lack of quantitative data makes statistical analysis difficult.
Part 2 Transect
Quadrat sampling along a transect is used to measure changes in species composition, population density, and distribution along an environmental gradient (e.g., soil moisture, altitude, light intensity).
Steps for Quadrat Sampling Along a Transect:
- Select the Study Area:
- Identify a gradient where environmental conditions change (e.g., from shoreline to inland, from a shaded area to an open field).
- Lay a Transect Line:
- Use a measuring tape or marked string to create a transect line along the gradient.
- Choose between:
- Line Transect: Record species touching the line.
- Belt Transect: Place quadrats along the line for more detailed sampling.
- Place Quadrats Systematically:
- Use a fixed interval (e.g., every 5m or 10m) along the transect.
- Ensure quadrats are placed consistently to provide comparable data.
- Record Species Data:
- Count the number of individuals per species within each quadrat.
- Measure percentage cover for plants and non-motile organisms.
- Note abiotic factors (e.g., soil pH, light intensity, humidity) to correlate with species distribution.
- Repeat for Accuracy:
- Conduct multiple transects across the study area to ensure reliable and representative data.
- Analyze Data:
- Plot species abundance against distance along the transect.
- Identify trends (e.g., certain species increasing/decreasing along the gradient).
- Compare with abiotic factors to determine causes of variation.
This method helps assess ecosystem changes, detect environmental impacts, and understand species adaptation to habitat conditions.
Part 3: Capture-mark-relsease-recapture
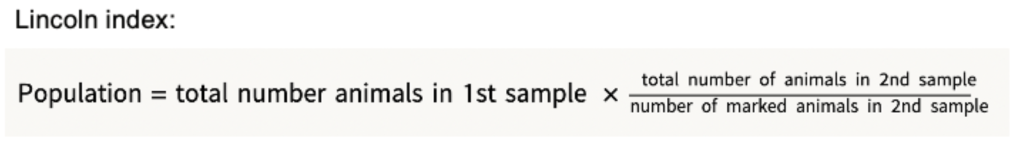
Lincoln Index
- used to estimate the total population size of mobile animals in a study area.
- it is unlikely that all the animals in a population are sampled, so a mathematical method is used to calculate the total numbers.
The Lincoln index is an indirect way of estimating the abundance of an animal population
- formula is used to calculate abundance rather than counting the total number of organisms directly
The markings must be:
- ethically acceptable (non-harmful)
- non-conspicuous (so that the animals are not more easily seen by predators)
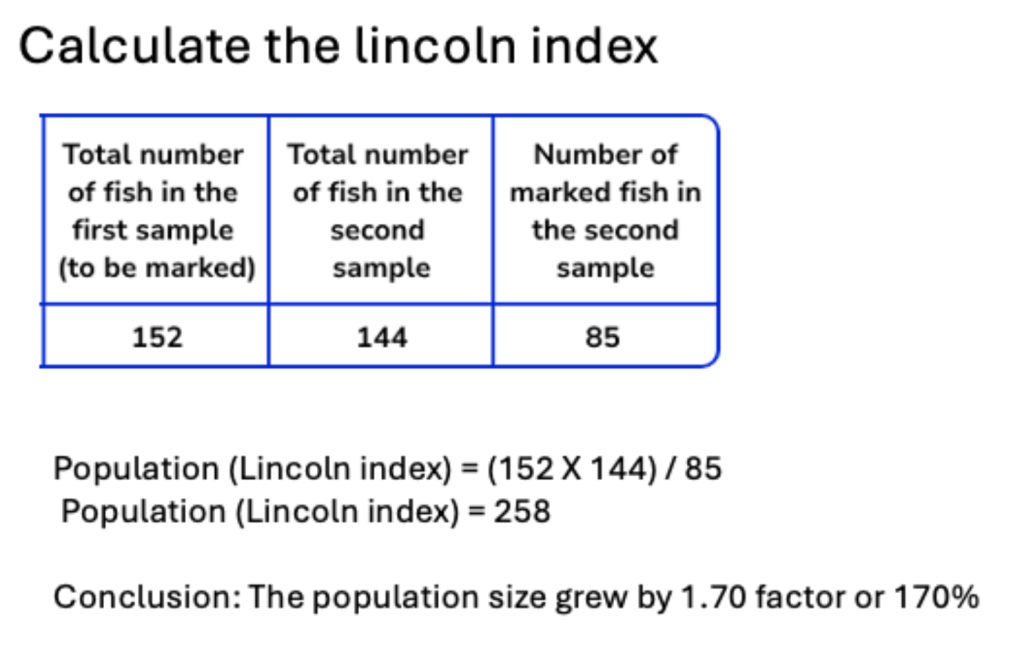
Conclusion: If every marked animal is recaptured, it is assumed that the marked individuals represent the entire population. However, if only half of the marked animals are recaptured, the total population is estimated to be twice the size of the initial sample.
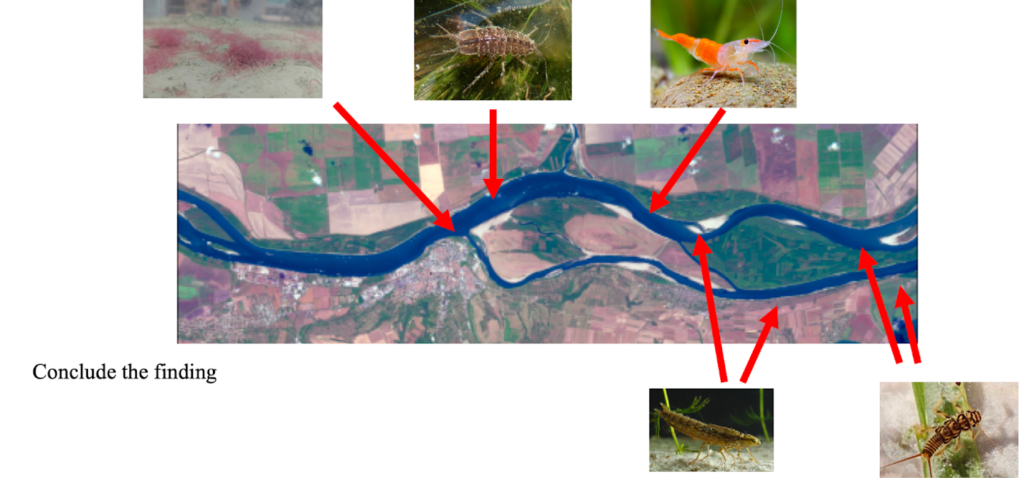
Part 4: [HL] Indicator Species
Living organisms that can be closely observed and whose presence, absence, or condition provides insight into the environmental state of their habitat (Landres et al., 1988; Cairns & Pratt, 1993; Bartell, 2006; Burger, 2006).
Indicator species respond to various environmental factors, including:
- Lichens and mosses, which are highly sensitive to airborne pollutants such as sulfur dioxide dissolved in water.
- Tubifex worms, which indicate contamination due to their sensitivity to heavy metal concentrations.
- Mayfly larvae and certain aquatic invertebrates, which serve as indicators of water quality due to their dependence on high dissolved oxygen levels.
![ESS 8.1.3 [AHL] Biocapacity and Environmental Migration](https://mypytrclass.com/wp-content/uploads/2025/12/image-4.png?w=1024)


![ESS 8.3.4 [AHL] Photochemical Smogs and Tropospheric Ozone](https://mypytrclass.com/wp-content/uploads/2025/12/image-1.png?w=1024)