
Learning objectives
- Outline classification using life cycle (r and K)
- Construct cladogram
- Outline advantages and difficulties in modern classification
Life Cycles and Human Impacts on Species
Life cycles vary considerably among species, reflecting differences in reproductive behaviour, lifespan, and ecological adaptations. Species can be broadly categorised based on their reproductive strategies and the degree of parental investment in offspring.
Species Life Cycle Differences and Classification
Species exhibit distinct life cycle patterns that can be classified according to their reproductive rates and parental care strategies. Two major reproductive strategies are commonly recognised: r-strategists (opportunistic species) and K-strategists (equilibrium species).
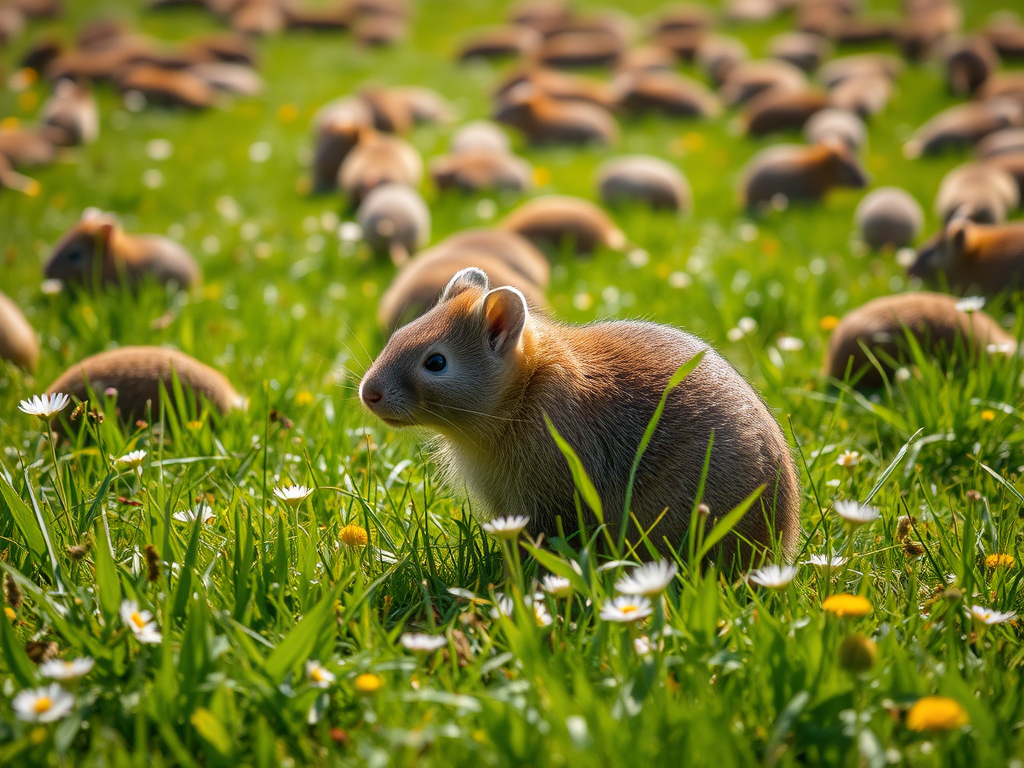
r-strategist species
- Opportunistic species
- Rapid population growth followed by abrupt declines.
- They typically inhabit unstable or frequently changing environments, where their ability to reproduce quickly provides a survival advantage.
- These species often produce a large number of offspring with minimal parental care, allowing them to rapidly exploit new or disturbed habitats.

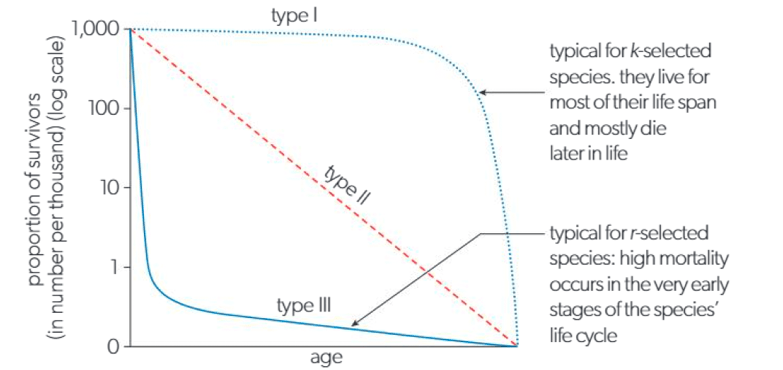
K-strategist species
- Equilibrium species
- Exhibit slower population growth, constrained by the carrying capacity (K) of their environment.
- Generally adapted to stable ecosystems, reproducing at lower rates but investing substantial energy in the care and survival of their offspring.
- Have longer lifespans, larger body sizes, and slower developmental rates.
- Due to their slow reproduction – susceptible to population declines and extinction when faced with increased mortality or environmental disruption.
Reproductive Strategies in Ecological Communities
The reproductive strategies of r- and K-species are closely linked to community succession stages. r-strategists dominate pioneer communities, where rapid colonisation and high reproductive rates are advantageous. In contrast, K-strategists are more prevalent in climax communities, where environmental conditions are stable and competition for resources is intense.
In predictable environments with stable resource availability, evolutionary pressures favour species that efficiently utilise resources and produce fewer offspring with higher survival probabilities. Conversely, in disturbed or unpredictable habitats, species that reproduce early, grow rapidly, and disperse widely tend to thrive. These species act as colonisers, contributing significantly to ecosystem productivity and recovery.
Human Impacts on Species and Ecosystems
Ecological research plays a critical role in elucidating species classifications, niche requirements, and life cycle dynamics. Such understanding is essential for assessing the impacts of human activities on ecosystems. Anthropogenic climate change, in particular, alters temperature regimes and seasonal patterns, disrupting the synchronised life cycles of plants and animals. Since many species depend on temporal coordination for reproduction, migration, and resource availability, these disruptions can lead to cascading effects on biodiversity and ecosystem stability. As climate change continues to accelerate, the integrity of species’ life cycles—and by extension, ecological balance—faces increasing threats.
Cladogram
Terminologies
- Cladistics (or phylogenetic systematics)
- Method used to classify organisms based on evolutionary relationships derived from common ancestry.
- It involves analysing shared derived characteristics to construct cladograms and identify clades.
- The central principle of cladistics is that classification should reflect evolutionary descent, not just physical similarity.
- Cladistic analysis helps scientists infer evolutionary pathways and revise taxonomic groupings to ensure that they represent true evolutionary lineages (i.e., clades).
- Cladogram
- A diagram that depicts the evolutionary relationships among organisms based on shared derived characteristics (called synapomorphies).
- It is a branching diagram that visually represents hypotheses about how species or groups are related through common ancestry.
- Each branching point, called a node, represents the most recent common ancestor shared by the descendants.
- Importantly, a cladogram does not show time or genetic distance — it simply illustrates patterns of shared evolutionary history.
- For example, a cladogram showing humans, chimpanzees, and gorillas would depict humans and chimpanzees branching from a more recent common ancestor than either shares with gorillas.
- Combining several independent cladograms, derived from different data sources, can help address potential errors or uncertainties.
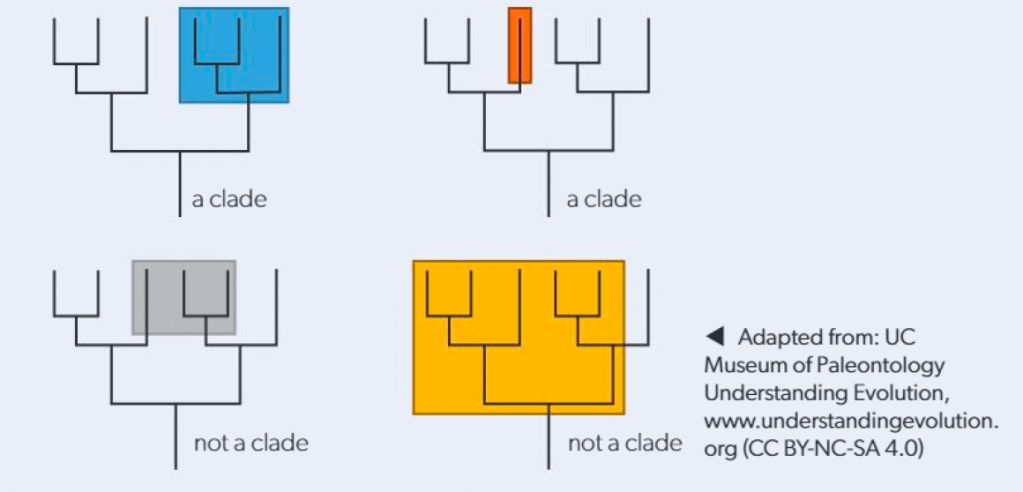
- Clade
- A group of organisms that includes a single common ancestor and all of its descendants. In other words, it represents a complete branch on the tree of life.
- Members of a clade share certain evolutionary traits inherited from their most recent common ancestor.
- For example, mammals form a clade because all mammals share a common ancestor that possessed traits such as mammary glands and hair.
- Clades can be large (e.g., vertebrates) or small (e.g., primates), depending on the level of ancestry being considered.
Skills – Analysing and Constructing Cladograms
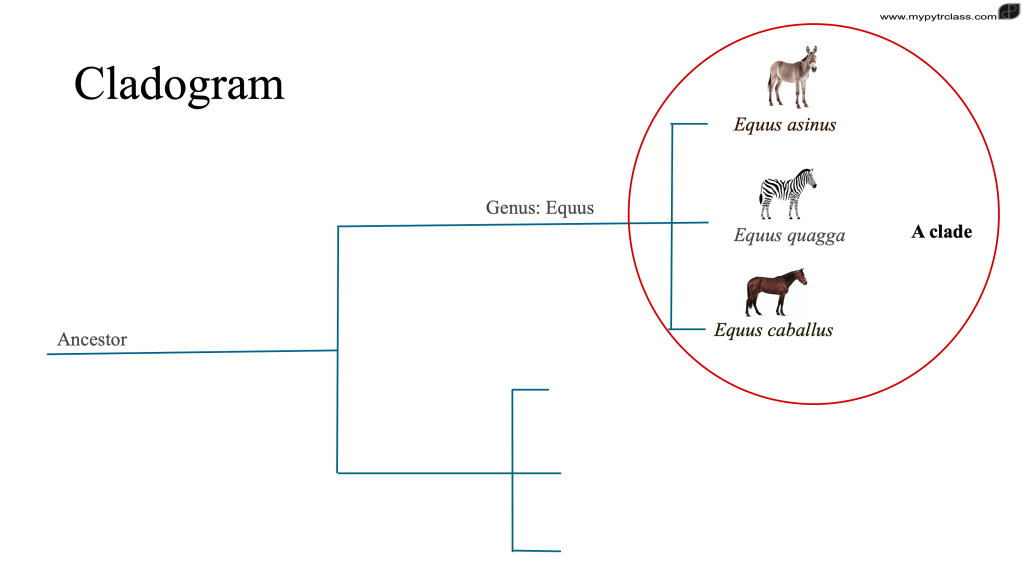
Based on the above cladogram, the genus Equus shows a clade consisting of 3 species
- all members in genus Equus are closely related
- all members in this genus will be considered as a clade
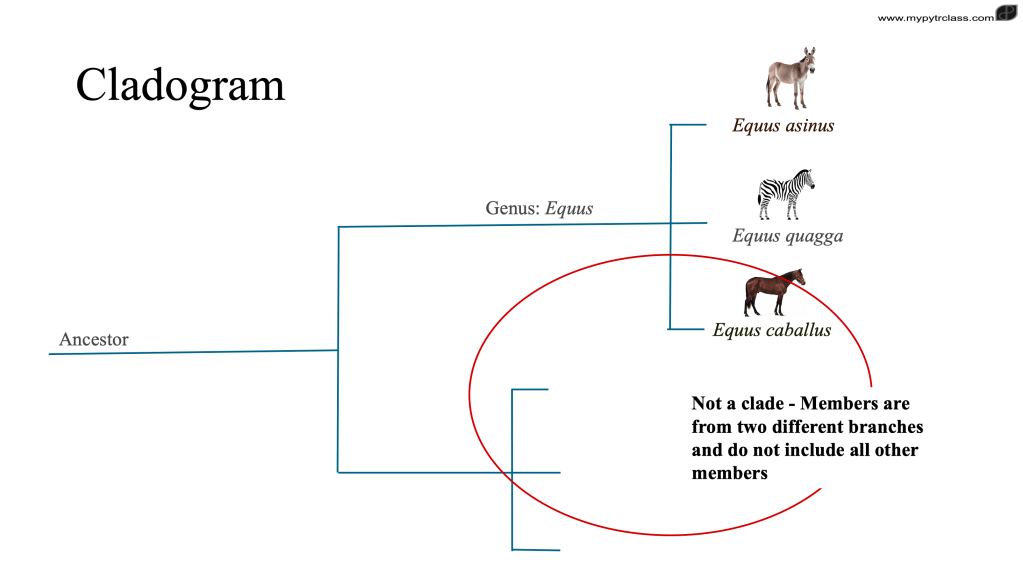
To sum, a clade must include all members from a node or a common ancestor of the group. This can be the most recent of earlier nodes
Activity
Construct a cladogram to show the evolutionary of human, chimpanzees, E. coli, yeast, hibiscus, bonobos, horses, eagle, crocodile, lizard, tuna, lion, tiger, leopard and orangutan. Submit your answer here and wait for feedback.


Difficulties in Cladistics
Clarifying Similarities and Classification Methods in Evolutionary Biology
- Distinguishing Similarities
- It is crucial to differentiate between similarities that result from:
- Shared ancestry (e.g., homologous structures) and those arising from independent evolution under similar selective pressures, leading to similar appearances.
- Analogous structures (e.g., the eyes of humans and octopuses), which evolve independently but serve similar functions.
- It is crucial to differentiate between similarities that result from:
- Appearance vs. Evolutionary Relationship
- Species that look alike may not be closely related; their resemblance often stems from analogous adaptations to similar environments, not shared ancestry.
- Morphology & Classification Errors
- Organism morphology (form and structure) can lead to misclassification due to confusion between analogous and homologous traits.
- Base or amino acid sequences are more reliable for determining clade membership, as they reflect true homology.
- Organism morphology (form and structure) can lead to misclassification due to confusion between analogous and homologous traits.
- Cladistics Evidence
- Cladistics has shown that using structural features alone for classification may not align with a species’ evolutionary origins.
- Improved Phylogenetic Accuracy
- The use of base and amino acid sequences has enhanced the accuracy of phylogenetic tree studies, as traditional morphology-based classification often fails to reflect the true evolutionary history of species.
Recent Improvements
OLD ways…
When classifying organisms, many possibilities in placing organisms with the same characteristics can occur. This was done based on observation of physical appearance of the organisms. For instance:
- similar species are grouped together into the same genus (plural, genera)
- similar genera are grouped together into families
- similar families are grouped together in orders
- similar orders are grouped together in classes
This allows us to predict group of organisms based on physical appearance.
More accurate ways…
- Using molecular biology, we can find similarities in organisms.
- Molecular biology can be analysed by checking the degree of similarities by comparing:
- chromosomes
- DNA sequence
- This can be done by the cell’s DNA, mitochondial DNA and/or chloroplast DNA
- other nucleic acid sequence such as mRNA, rRNA etc
- protein sequence (amino acids)
- Molecular method provides more accuracy
- The use of base and amino acid sequences has made the study of phylogenetic trees more accurate.
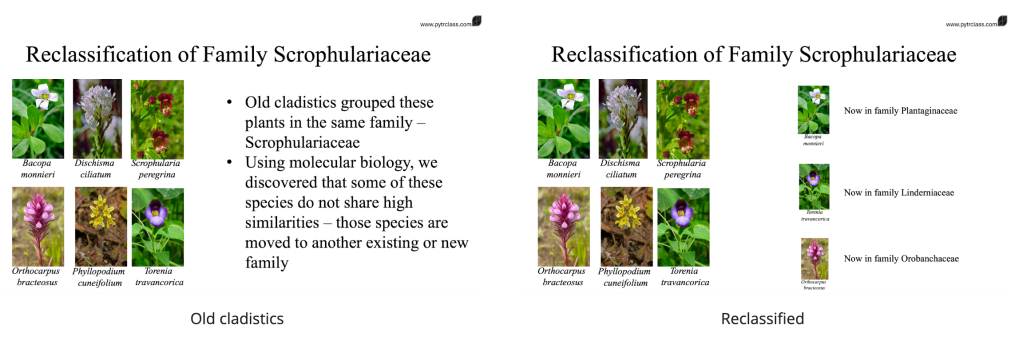
- Reclassification has led to:
- some groups merging with others
- some groups being divided
- some species being transferred from one group to another.
Notes and Exercise
Subscribe to get access
Read more of this content when you subscribe today.
![ESS 8.1.3 [AHL] Biocapacity and Environmental Migration](https://mypytrclass.com/wp-content/uploads/2025/12/image-4.png?w=1024)


![ESS 8.3.4 [AHL] Photochemical Smogs and Tropospheric Ozone](https://mypytrclass.com/wp-content/uploads/2025/12/image-1.png?w=1024)