
Learning Objectives
- Describe the meaning and measurement of biodiversity
- Describe an investigation to analyse species diversity using Simpson’s Index
Part 1: Biodiversity Definition
Definition of Biodiversity
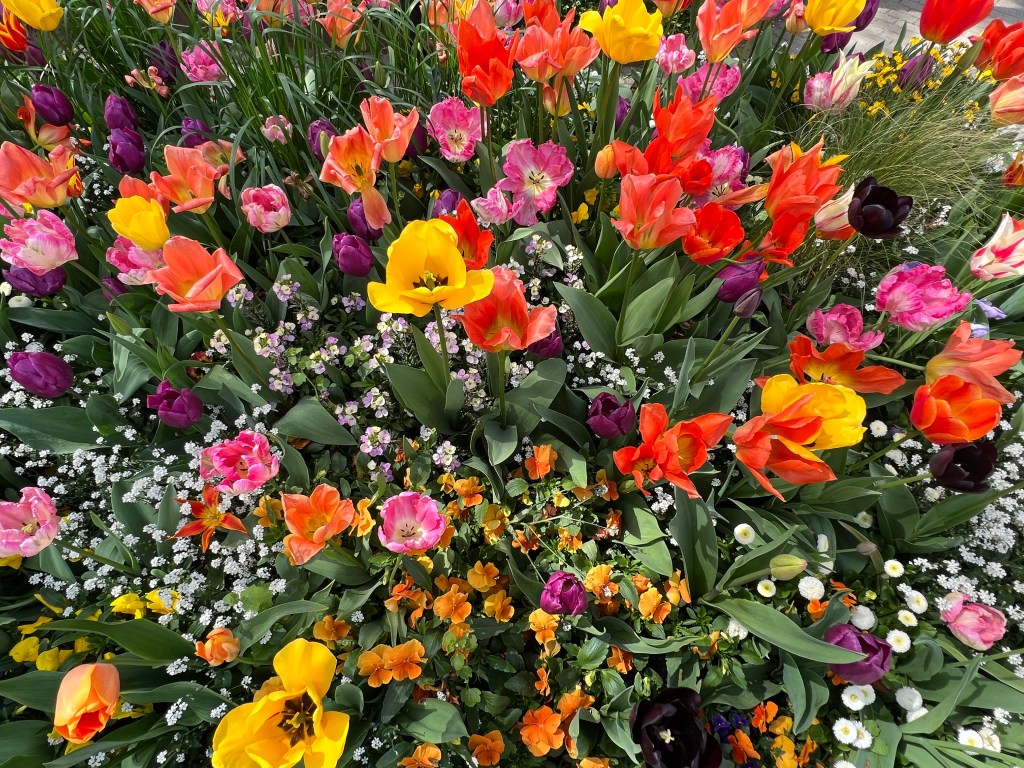
Diversity is a measure of both the number of species in an area and their relative abundance. Biodiversity is the total diversity of living systems and exists at several levels. It is a result of habitat diversity, species diversity and genetic diversity
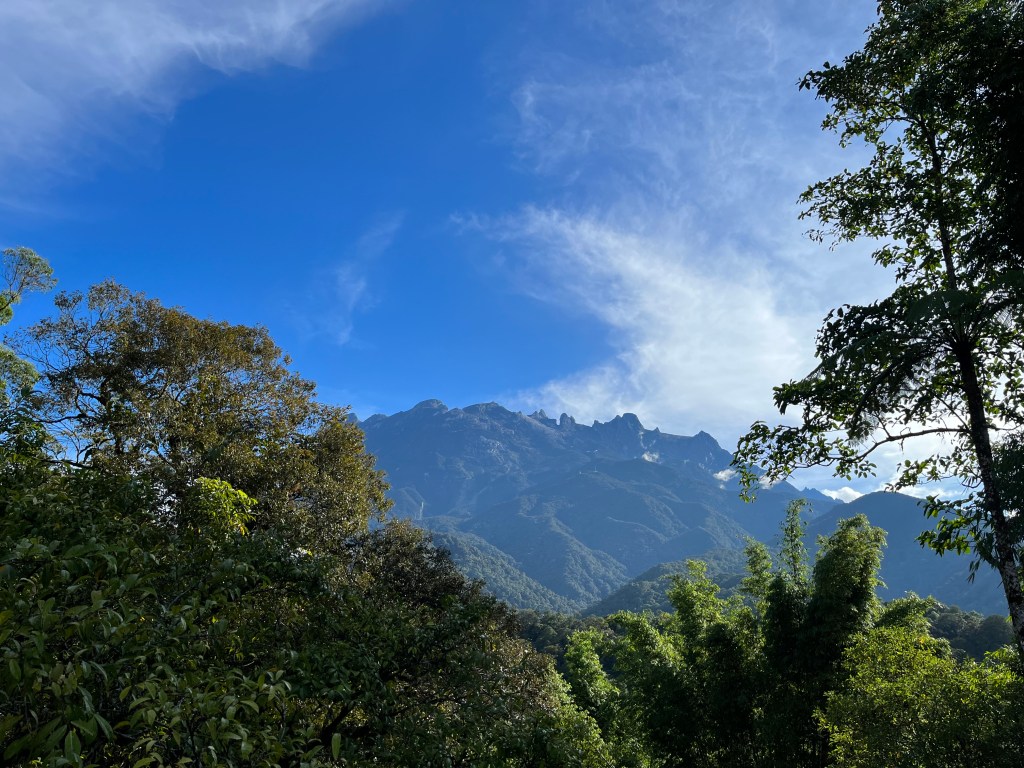
Mt. Kinabalu is located in Borneo. This island is one of the most important biodiversity hotspots in the world. Mt. Kinabalu itself has more than 600 species of fern. The whole Africa only has 500 species of fern
Biodiversity has 3 levels:
Habitat Diversity
The variety of habitats within an ecosystem or biome, often linked to the diversity of ecological niches. For instance, woodlands exhibit high habitat diversity as they encompass multiple habitats like rivers, soil, trees, shrubs, ground vegetation, leaf litter, and fallen trees. Conversely, deserts have low habitat diversity, consisting of only a few habitats, such as sand and sparse vegetation.
Species Diversity
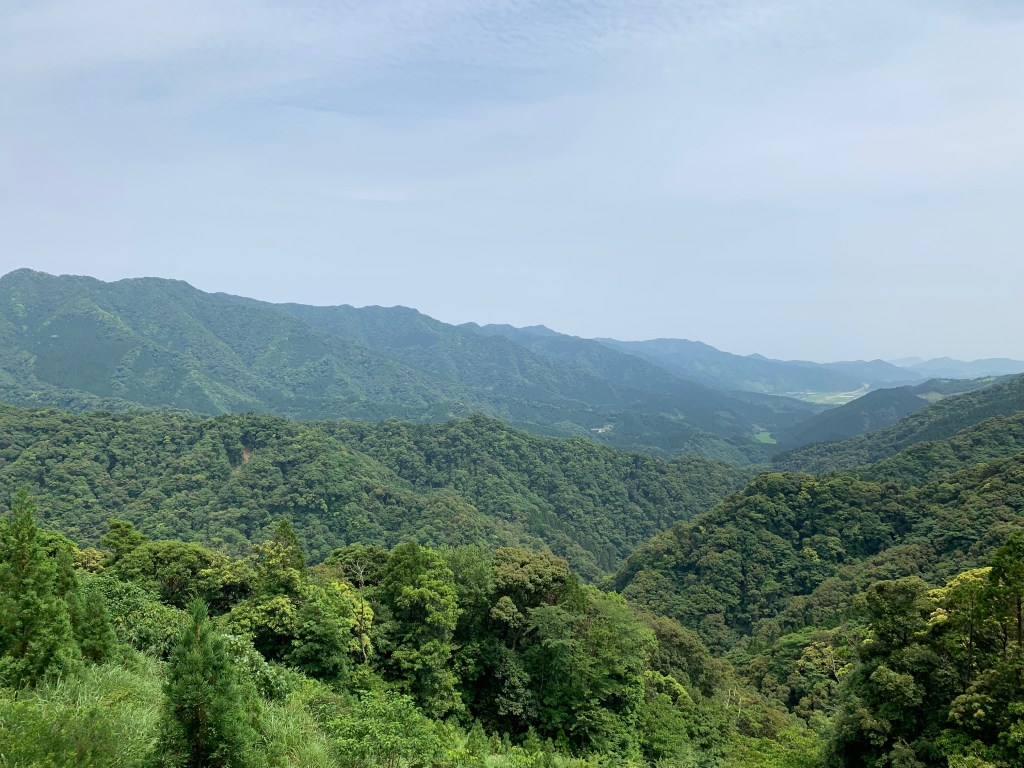
The number of species per unit area, considering both species richness and their relative abundance. Greater species diversity in a community or ecosystem leads to increased complexity. Ecosystems with high species diversity, such as primary rainforests, are more resilient and less likely to be disturbed. Species diversity is a key aspect of overall biodiversity within an ecosystem.
Genetic Diversity
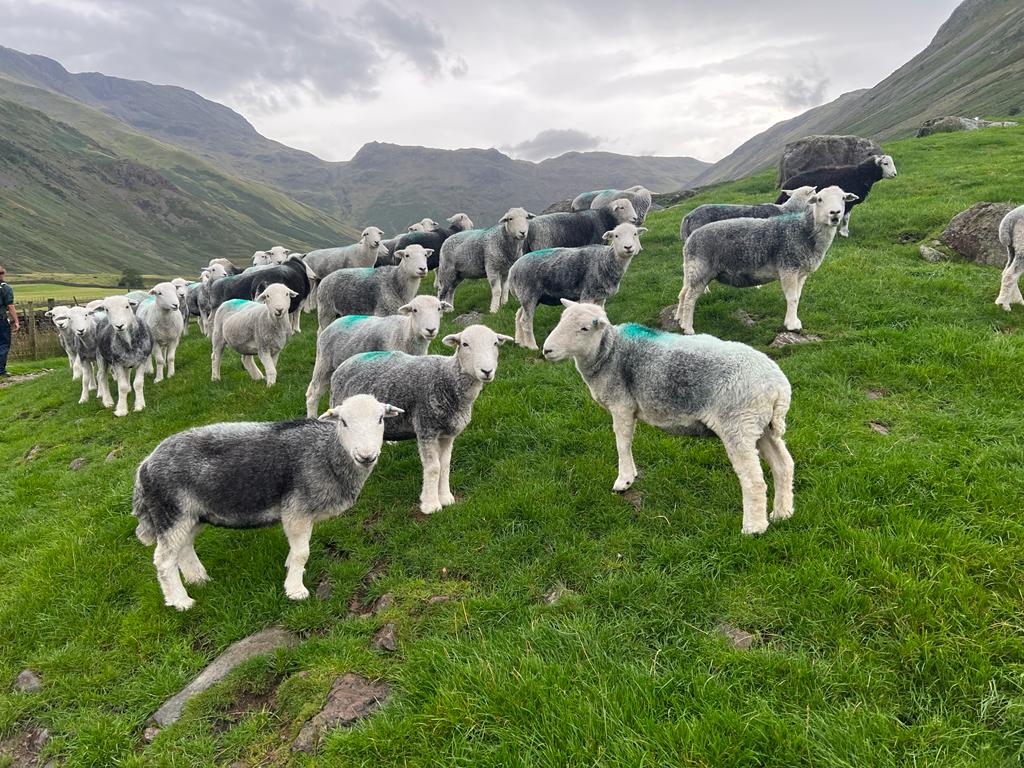
The gene pool includes all the different genes present in every individual of a species. A larger gene pool results in high genetic diversity, while a smaller gene pool leads to low genetic diversity. Genetic diversity typically refers to variation within a single species but can also describe the genetic variation among all species in a given area. This figure illustrates a sheep with low genetic diversity.
Classification of Organisms
- Organisms are classified into a hierarchical system of taxonomic groups based on similarities.
- There are an estimated 8 to 30 million species globally, but only a fraction have been discovered and described.
- The main kingdoms of classification are Animalia, Plantae, Fungi, Protista, and Monera. Each kingdom is further divided into phyla, classes, and species, with each species occupying a specific ecological niche.
- Over 2 million species have been identified, including 1 million insect species, 425,000 plant species, and nearly 6,600 mammal species. Some groups, like insects, fungi, arachnids, and algae, have many undiscovered species.
- Biodiversity is likely underestimated, emphasising the importance of protecting habitats, especially those that have not yet been fully studied.
- [Recall about system and sustainability] Describe how components of biodiversity contribute to the resilience of ecological systems
- The various components of biodiversity, including genetic, species, and ecosystem diversity, play a crucial role in maintaining the resilience of ecological systems. Higher biodiversity enhances an ecosystem’s ability to withstand environmental changes, recover from disturbances, and adapt to new conditions. Genetic diversity within populations allows species to evolve and survive in changing environments, while species diversity ensures ecosystem stability by supporting complex interactions such as food webs and nutrient cycles. Additionally, diverse ecosystems provide essential services like climate regulation, water purification, and soil fertility, all of which contribute to overall ecological resilience.
HL.b Environmental Economics
- As economies grow, technological innovations become the focus for solving global environmental issues.
- This shift diverts funding towards species conservation, reducing resources for taxonomic research.
- Conservation efforts are often supported by museums, universities, and societies like the Asian Society for Arachnology.
- These societies depend on scientists to create research opportunities.
- Funding is competitive, leading to certain groups of organisms receiving less attention than others.
Part 2: Measuring Biodiversity
Species Diversity
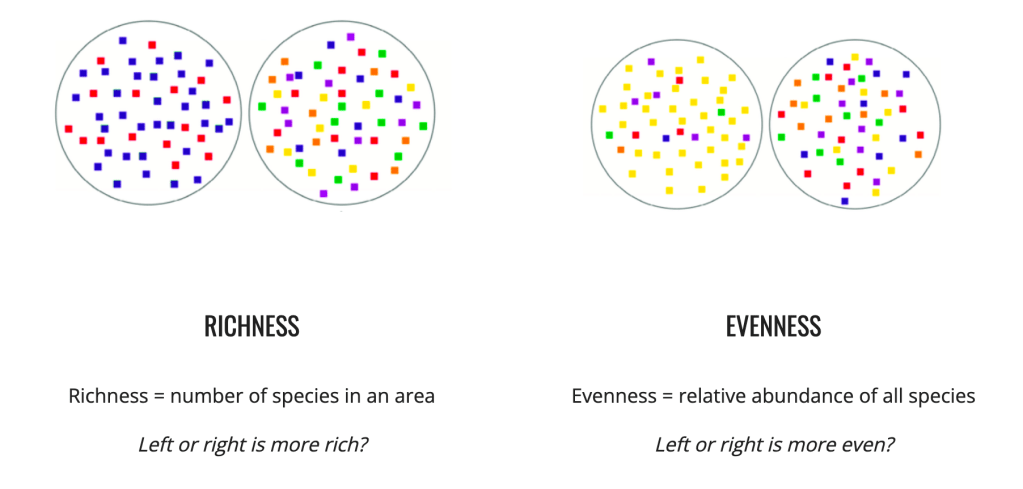
- Richness and evenness are components of biodiversity
- High evenness = complex ecosystem – a lots of different niches that support a wide range of different species
- Low evenness = low complexity and smaller number of potential niches – community where one or a few species dominate
- Communities can be described and compared using indices such as Simpson’s index, D value (described below)
- High D value indicates that the system is stable. Many niches support each other and contribute to the resilience of the system towards external factors/disturbances
- Small disturbances may not have an impact on the system
- When doing this, we can compare similar communities for example in two different ponds that show the same or similar communities (in general niches)
- Low diversity may be due to pollution or recent colonisation
- Biologists assess the effect of disturbance (pollutions or colonisation) using diversity indices, such as the Simpson’s index.
- This quantification of biodiversity is important to conservation efforts so that areas of high biodiversity are identified, explored, and conserved.
- Areas that are high in biodiversity are known as hotspots.
- Home for large numbers of endemic species (species not found anywhere else),
- The measures of biodiversity are essential in identifying areas that should be protected against damaging human activities.
- Example:
- Tumbes-Chocó-Magdalena – an area that includes the forests of the South American Pacific coast (from Panama to Peru)
- Galápagos Islands.
- Borneo rainforest of Malaysia
- Atlantic Forest of Brazil
Part 3: Simpson’s Index Activity
This section is the same as the use of quadrats and transects in ESS Topic 2
- Simpson’s index can be used to monitor the complexity of two different areas that home the same or similar communities
- The following activity is a field visit and investigation of biodiversity using Simpson’s index and quadrat
- The placement or quadrat i.e the sampling location must be randomised to eliminate bias in the investigation
- The quadrat is use to find the number of individuals for each species present per unit area
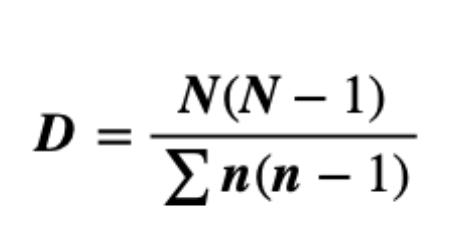
Simpson’s index, D, is identified using the above formula. To simplify, use the following manual to use Simpson’s index
Example of Simpson’s Index Investigation
Note: This kind of activity also qualifies for ESS and biology internal assessment in the IBDP curriculum
- Research Question
- How does distance from a coal and fossil fuel power plant affect plant diversity in the surrounding field within 10km radius measured using Simpson’s index
- Introduction to the investigation
- Due to the increase in electricity demand in country A, a new power plant has been built in area near a forest. This new electricity plant deforested a large area and burning coal and fossil fuels to generate electricity
- On daily basis, the power plant releases tonnes of carbon diaxide to the air. As the plant also uses coal and fossil fuels, it releases the gasses containing sulfur such as sulfur dioxide (SO2). This has caused acid rain
- The acid rain has a direst impact on the soil pH in the nearby forests.
- Over the course of a year, the soil pH and the plant biodiversity was monitored to assess the impact of the power plant. The government tried to mitigate some observable impacts of the power plant by enforcing the requirement of hydrodesulfurisation to remove sulfur from the fossil fuels prior to the combustion.
- Tensions occur between the firm and the government as this technology would require high cost for installation and maintenance considering that only 40% of the energy source can be applied with hydrodesulfurisation.
- Hypothesis
- The more acidic the soil, the lower the plant diversity in the area
- Acidic soils stunt plant growth in many ways
- Wet deposition causes soil to become more acidic
- This causes the soil to dissolve extra metal cations in the soil (minerals).
- These cations can be absorbed by the plants as they take in water.
- As the result, plant could absorb toxic level of metal cations such as mangenese and aluminium
- The plant growth will be stunted. Green leaves may not be formed and eventually plants will die
- Acid soils inhibit seed germination for new plant to emerge
- Acidic soil deactivate and destroy enzymes that are needed for seed germination.
- Variables
- Independent variable: Distance of sampling from the power plant to the forest
- Distances are: 2km, 4km, 6km, 8km and 10km of the surrounding field
- Independent variable: Distance of sampling from the power plant to the forest
-
- Dependent variable:
- Plant biodiversity measured by Simpson’s index
- Dependent variable:
-
- Controlled variables
- Elevation: This was maintained at below 500m. The field surrounding the power plant was flattened and therefore, the elevation was controlled
- Time of the year: The sampling was done in summer as this enable precipitation and the effect of pH to act on the soil and plants in the field. All sampling was also done around the same time in a day to increase the accuracy and precision of the quantitative data
- Randomised sampling: Using quadrat that are randomly placed at different points of each km internal
- Species monitored: The sampling only focuses on 5 plant species (P, Q, R, S and T) in the field. Other species are not recorded
- Controlled variables
-
- Uncontrolled variables
- Plants’ mutation rate: Some plants may mutate at different rate in a selected area. This may increase their chance to adapt to the external factors
- Distribution of rain: Rain distribution in the field may be uneven and hence some areas in the same km internal may have different acidity.
- Wind and diffusion of dry deposition: The movement of dry air particles containing acidic substance cannot be controlled. It follows the wind movement in general
- Uncontrolled variables
- Methodology
- Using a drone, a photograph was taken of the 10km radius within the power plant
- A randomiser was used to select 5 different areas in each 2 km internal
- Once the 5 areas was selected for the first 2km radius, a quadrats were place in the precise areas
- The number of individuals of each of the 5 selected species (P, Q, R, S and T) was recorded in each of the 5 quadrats
- Step 2 and 3 were repeated for radius between 2 km and 4 km. Then the same steps were used for the next 2 km radius until the sampling reaches 10km radius
- All data were recorded and organised into new table for Simpson’s index
- Qualitative Data
- This is needed for IAs. However, for the same of this activity, we will skip this for now. In general, this should focus on quality only such as heat, colour, state of appearance, behaviour etc
- Quantitative Data
- Raw and processed data (calculated):
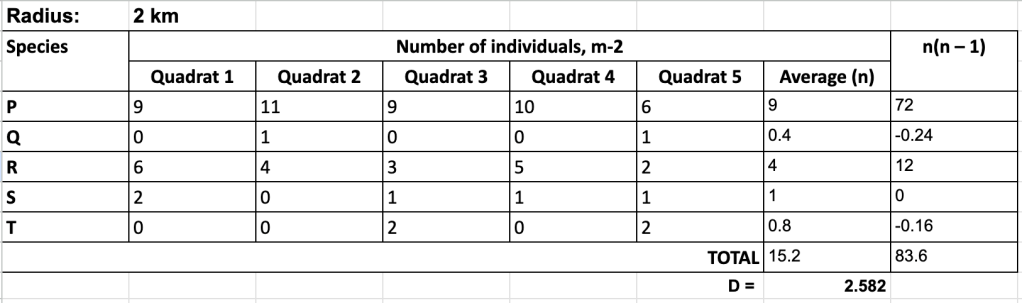

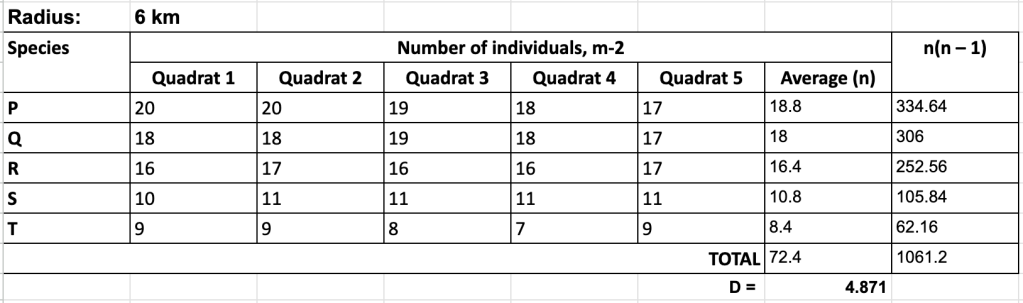
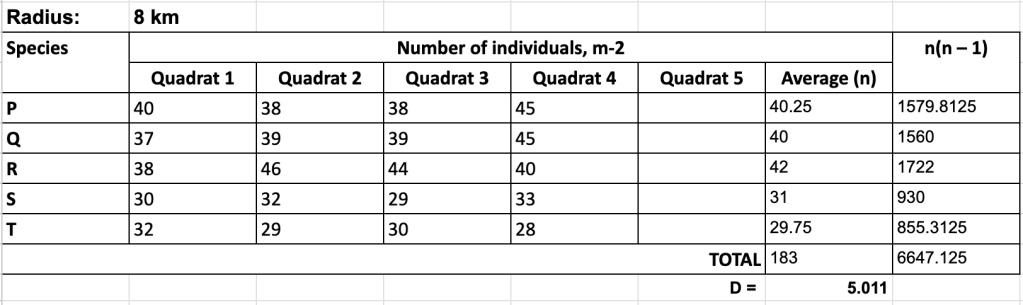
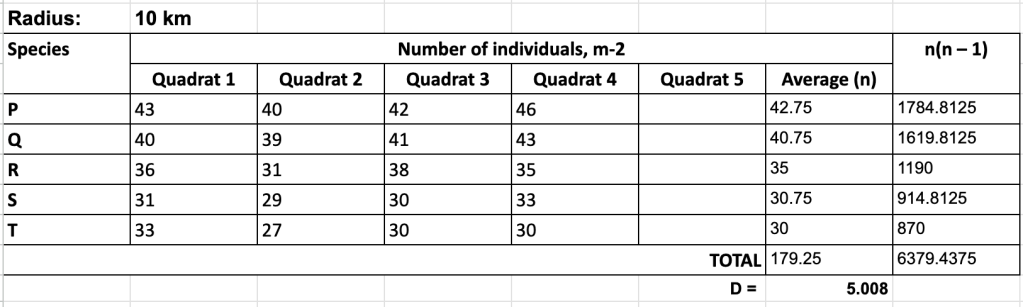
- Based on the above data, the species diversity using Simpson’s Index should be concluded using these key idea:
- Higher values (closer to 1) indicate greater diversity and ecosystem stability.
- This would mean that the ecosystem has high resilience
- Lower values (closer to 0) indicate lower diversity and possible ecosystem imbalance.
- Higher values (closer to 1) indicate greater diversity and ecosystem stability.
Subscribe to get access
Question: [Recall about system and sustainability] Describe how components of biodiversity contribute to the resilience of ecological systems
The various components of biodiversity, including genetic, species, and ecosystem diversity, play a crucial role in maintaining the resilience of ecological systems. Higher biodiversity enhances an ecosystem’s ability to withstand environmental changes, recover from disturbances, and adapt to new conditions. Genetic diversity within populations allows species to evolve and survive in changing environments, while species diversity ensures ecosystem stability by supporting complex interactions such as food webs and nutrient cycles. Additionally, diverse ecosystems provide essential services like climate regulation, water purification, and soil fertility, all of which contribute to overall ecological resilience.
![ESS 8.1.3 [AHL] Biocapacity and Environmental Migration](https://mypytrclass.com/wp-content/uploads/2025/12/image-4.png?w=1024)


![ESS 8.3.4 [AHL] Photochemical Smogs and Tropospheric Ozone](https://mypytrclass.com/wp-content/uploads/2025/12/image-1.png?w=1024)