Learning Objectives
- Explain the variation of productivity in terms of stratification and nutrients
- Evaluate the assessment of fish stocks and monitoring of harvest rates
- Explain the risk of harvesting at MSY
- Describe different perspectives influencing the recovery of overexploited species
Part 1: Productivity, Thermal Stratification, Nutrient Mixing and Nutrient Loading

Ocean Productivity and Photosynthesis
- Productivity is higher in:
- Shallow areas (sunlight reaches seabed).
- Nutrient-rich zones (e.g., estuaries, upwelling currents).
- Coastal areas (nutrients from rivers and land runoff).
- Some lake systems.
- Ocean productivity = Organic matter production by phytoplankton.
- Phytoplankton are photoautotrophs using sunlight to create food energy.
Light and Photosynthesis in the Ocean
- Sunlight is essential for life, including in the deep ocean.
- In the ocean, light is absorbed and scattered:
- Very little penetrates beyond ~80 m.
- Penetration depth ranges:
- Up to 150 m in low-productivity subtropical areas.
- As shallow as 10 m in highly productive coastal areas.
- Photosynthesis mainly occurs in the photic zone (upper sunlit layer of the ocean).
Ocean Layers and Mixing
- In low- and mid-latitude oceans:
- Sunlight warms surface water, making it less dense and more buoyant.
- Warm water stays above denser cold deep water.
- The boundary between them = thermocline.
- Winds can mix water across the thermocline, moving nutrients from deep to surface.
- Light + seawater density interaction is crucial for phytoplankton success.
Nutrients and Productivity
- Deep Chlorophyll Maximum (DCM):
- Zone with enough light for photosynthesis and nutrient supply from below.
- Thin buoyant surface layer limits productivity:
- Organic matter sinks, taking nutrients with it.
- Nutrients accumulate in deep, dark waters.
- Due to density differences, nutrients rise slowly or only via upwelling.
- Surface waters limit productivity by moving nutrients away from light.
Geographic and Seasonal Variations in Productivity
- Satellites track ocean surface color to monitor chlorophyll (photosynthesis indicator).
- Higher productivity found:
- Near the Equator and coastlines.
- In eastern margins (wind pushes warm water aside, allowing deeper nutrient-rich water to rise).
- In high latitude oceans (frequent upwelling and vertical mixing).
- Low/mid-latitude oceans:
- Warm surface water stays separate from cold, nutrient-rich deeper water due to density differences.
- Limited vertical mixing = reduced nutrient supply = lower productivity.
- High latitude oceans:
- Cold surface water sinks, enhancing vertical mixing.
- Nutrient supply exceeds phytoplankton demand due to good light and mixing.
- Seasonality:
- Strongest at high latitudes.
- Summer has more sunlight (intensity + duration) → increased photosynthesis.
Part 2: Assessment of Fish Stocks and Monitoring of Harvest Rates
Assessment of Fish Stocks and Monitoring of Harvest Rates
- Purpose:
- Ensures conservation and sustainable use of fish stocks.
- Helps estimate the size and health of exploited fish populations.
Methods for Estimating Fish Population Size and Health:
- Catch Data:
- Includes age, size, weight, and species caught by commercial/recreational fishers.
- Used to estimate fish population size and distribution.
- Scientific Surveys:
- Conducted from research vessels.
- Tag and Recapture Surveys:
- Tracks movement and population data over time.
Monitoring Harvest Rates:
- Done through analysis of logbooks:
- Records size of catch, species, equipment, and location.
- UK vessels must submit data within 48 hours of landing.
- Allows long-term monitoring but does not detect illegal fishing.
- FAO Stock Status Plot (1996):
- Analyzed trends in ~400 well-studied fisheries.
- Stocks categorized as:
- Developing: Catch levels increasing.
- Senescent: Catch levels declining.
- By the mid-1990s, 20% of stocks exploited in the 1950s had collapsed.
Challenges in Predicting Fish Stock Sizes:
- Many influencing factors:
- Policy changes, energy costs, market shifts, disasters, climate change, acidification, demand changes.
- Catch data remains a vital indicator.
- Limitations of Stock Assessments:
- Costly and difficult, especially when using research vessels.
- National governments may use catch data to evaluate industry viability.
- A 2013 study (Nature) estimated under-reporting of catches:
- 100–500% in LICs/MICs.
- 30–50% in HICs.
Catch Numbers vs. Actual Fish Populations:
- Number of fish caught ≠ number of fish in the ocean.
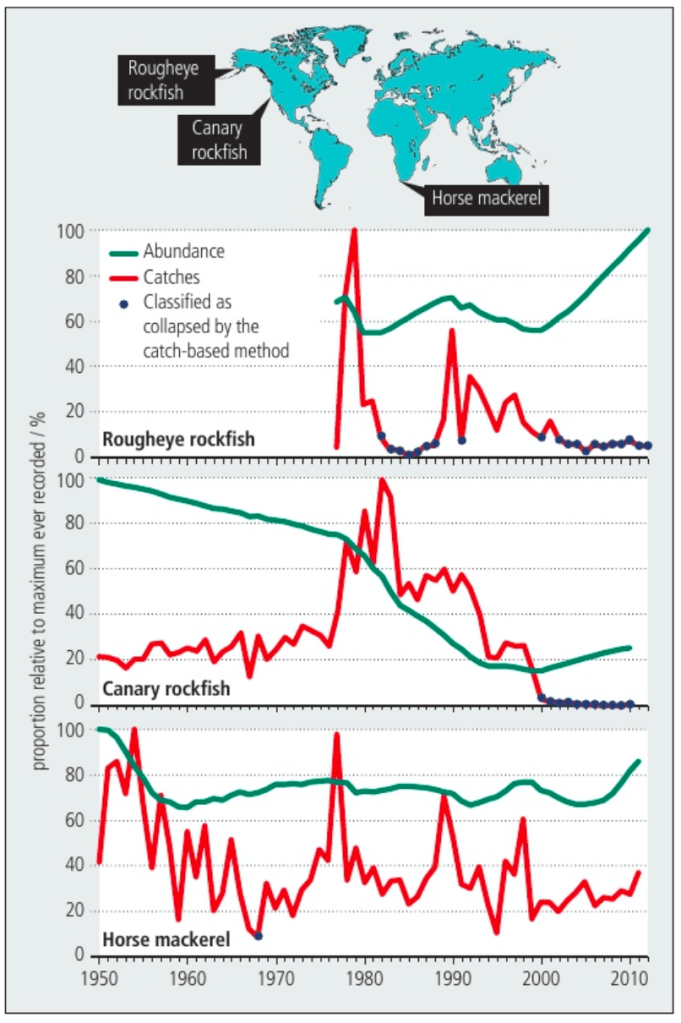
- By mid-2000s, 14% of 166 stocks had collapsed.
- Fishing restrictions often led to stock recovery (e.g., Rougheye rockfish).
- Example: East USA – haddock & redfish abundance rose over 5× between 1995–2007 due to regulations.
Catch Size Doesn’t Always Indicate Stock Health
- Smaller catches can result from:
- Market changes.
- New fishing regulations.
- E.g., 34 USA West Coast stocks seemed collapsed due to low catches, but only 3 had truly collapsed.
- Shark catch declines may reflect reclassification, not actual depletion.
Additional Influences on Catch Data:
- Changes in exclusive economic zones.
- Disasters (e.g., oil spills).
- Fuel cost increases and price drops.
- Most nations only monitor their most economically important fisheries.
Part 3: Risks of Fishing at the MSY
Risks of Fishing at the Maximum Sustainable Yield (MSY)
- MSY = Maximum Sustainable Yield:
- Largest long-term annual harvest that can be taken from a stock without depleting it.
- Used to estimate how much fish can be sustainably caught.
- Risks of MSY:
- MSY is only an estimate and hard to calculate accurately.
- Harvesting at or above MSY can:
- Reduce fish reproductive potential.
- Cause rapid decline in fish stocks.
- Trigger positive feedback loops leading to stock collapse.
- MSY is affected by multiple environmental and biological factors.

MSY and Biomass:
- Biomass = Total weight of a stock; influenced by:
- Growth, reproduction, and mortality rates.
- Fish species vary in:
- Growth speed (e.g., cod vs. herring).
- Reproductive output (e.g., cod vs. sharks).
- Lifespan and stability of stock size (e.g., sand eels vs. cod).
- Fishing impacts biomass by:
- Removing large numbers of fish → reduces reproductive capacity.
- Long-term → population decreases.
- Factors Influencing MSY Calculations:
- Growth rate of fish.
- Reproduction timing.
- Fish mortality rate.
- Abiotic factors (e.g., temperature, salinity, oxygen, acidification).
- Biotic factors (e.g., predator-prey relationships, parasites).
- Fishing methods used.
Criticism from Peter Larkin (1977) – An Epitaph for the Concept of MSY:
- MSY risks population health because it:
- Ignores spatial productivity variation.
- Ignores impact on non-target species.
- Only considers benefits, not costs of fishing.
- Is vulnerable to political manipulation.
- MSY also:
- Assumes all individuals in a population are the same.
- Assumes harvest levels are the same each year—ignores variability.
Scientific Concerns:
- Some scientists see MSY as a maximum average yield, not a fixed number.
- Natural and human-induced changes cause harvest fluctuation.
- Real-World Consequences of Overfishing at MSY:
- Overfishing has devastated large fish stocks in:
- Northwest Atlantic, North Sea, Peru’s anchovy industry, and whale fisheries.
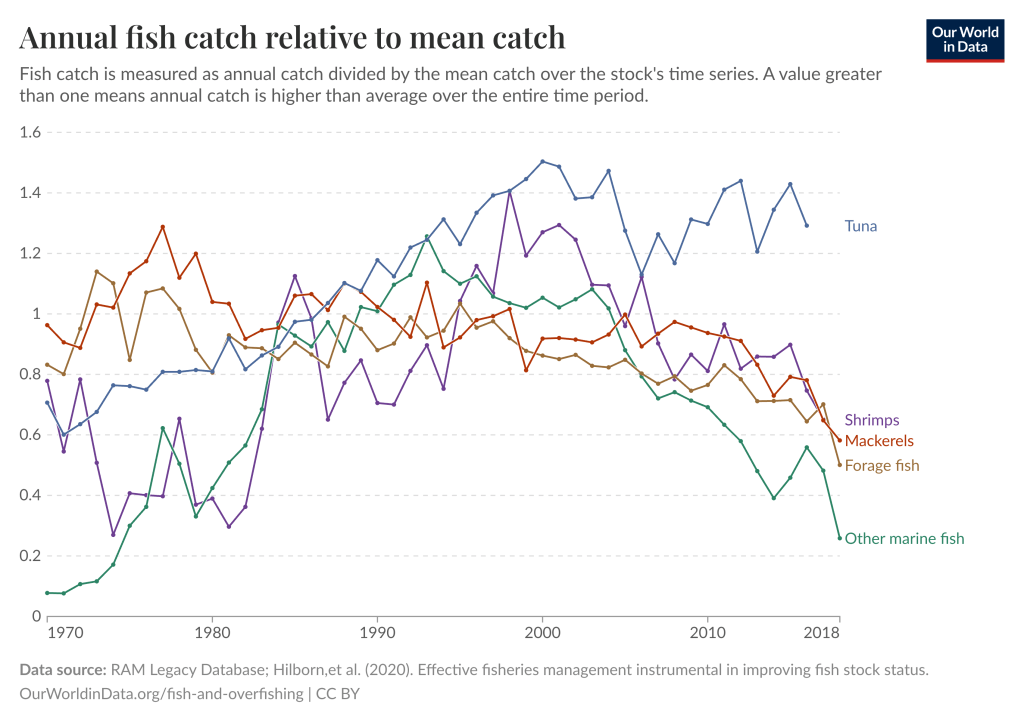
- Leads to depletion of large, high-value species (e.g., cod, tuna).
- Fishing fleets move down the food chain to catch smaller, less valuable species.
- Overfishing has devastated large fish stocks in:
MSY Challenges in Practice:
- Often based on unreliable or insufficient data.
- Accurate estimates require data on:
- Population size.
- Growth rates.
- Makes MSY application difficult and sometimes impractical.

Part 4: Recovery of Overexploited Fish Species
- Stakeholders in the fishing industry include:
- Governments
- Consumers
- Non-governmental organizations (NGOs)
- Retailers (e.g., fish markets and supermarkets)
| Stakeholder | Interests / Goals |
|---|---|
| Government | – Maintain employment in the fishing industry – Generate tax revenue – Ensure a healthy and sizable fish population |
| Fishing Industry | – Maximize profits – Increase catch sizes – Shift to other fishing grounds if local stocks decline |
| Consumers | – Affordable fish in markets – Continuous availability – Support for large-scale fishing and aquaculture |
| NGOs | – Protect fish stocks – Promote sustainable fishing practices – Advocate for bans on harmful practices (e.g., fishing young or endangered fish) |
| Retailers | – Secure and sufficient fish supply – Affordable prices for consumers |
- Managing Differences:
- Typically resolved via discussion and negotiation
- Restrictions may apply to:
- Certain fish species
- Specific times or areas for fishing
- Penalties may be imposed on law-breaking vessels
- Recovery of Overfished Species:
- Requires cooperation among stakeholders (governments, industry, NGOs, markets, etc.)
- Recovery measures include:
- Temporary fishing bans
- Fishing license limits
- By-catch prevention
- Public education on sustainable fish choices
- Global Decline of Fish Stocks:
- Overexploitation is widespread
- Agencies must create rebuilding plans when stocks become overfished
- Rebuilding Fish Stocks involves:
- A reduction in fishing to let populations reach sustainable levels (MSY – Maximum Sustainable Yield)
- Once the fish reaches MSY, it’s removed from the overfished list
- It remains on the rebuilding list until it hits the target population
- 2021 USA Example:
- 45 fish stocks had rebuilding plans
- Only 6 were no longer classified as overfished
![ESS 8.1.3 [AHL] Biocapacity and Environmental Migration](https://mypytrclass.com/wp-content/uploads/2025/12/image-4.png?w=1024)


![ESS 8.3.4 [AHL] Photochemical Smogs and Tropospheric Ozone](https://mypytrclass.com/wp-content/uploads/2025/12/image-1.png?w=1024)