
Learning objectives
- Consolidate the knowledge and understanding to explain connection between keystone species and tipping point in terms of trophic cascade
Part 1: The Concept of Tipping Point
Tipping Points and Ecosystem Stability
- A tipping point is the threshold at which a small change causes a drastic shift in the ecosystem’s state.
- After a tipping point is crossed, the ecosystem may shift to a new equilibrium that is difficult or impossible to reverse.
- Human activities can cause tipping points that disrupt ecosystem stability.
- A tipping point leads to the collapse of the original ecosystem and the formation of a new equilibrium.
- Example:
- Deforestation in the Amazon reduces transpiration.
- This decreases water vapor production, cooling, and precipitation.
- Result: reduced ability of the forest to sustain itself.
Measuring Changes in Ecosystems Due to Human Activity
Human impacts on ecosystems include:
- Toxins from mining and landfills.
- Eutrophication
- Effluent and oil spills.
- Overexploitation of natural resources.
- Land-use changes (e.g. deforestation, development, tourism).
Factors influencing ecosystem change:
- Changes vary depending on the type of human activity.
- Measurement methods must align with the specific activity studied.
Example study locations:
- Forests harvested for timber.
- Grasslands disturbed by foot traffic.
Methods for studying human impact:
- Capture–mark–release–recapture for invertebrates
- Simpson’s reciprocal index to measure species diversity
- Indicator species to assess ecosystem health
- Abiotic measurements:
- Light levels, temperature, wind speed.
- Tree biomass indicators: average DBH (diameter at breast height) and canopy openness.
- Soil erosion assessment:
- Measure soil depth under rocks in high-rainfall areas.
- Soil variable measurements
- Soil structure, nutrient content, pH, compaction, moisture.
Part 2: The Keystone Species and Trophic Cascade
Keystone Species
- A keystone species has a disproportionately large impact on its ecosystem relative to its abundance.
- These species play a critical role in maintaining the structure, diversity, and stability of a community.
- Removal of a keystone species can trigger significant changes in the ecosystem.
Trophic Cascade
- A trophic cascade is an ecological process that starts at the top of the food chain and tumbles down to lower levels.
- When a top predator (often a keystone species) is removed, it can lead to:
- Overpopulation of prey species.
- Depletion of vegetation or lower trophic levels.
- Disruption of ecosystem balance.
Part 3: Case Studies
Case Study 1: Sea Otters as a Keystone Species
- Sea otters (keystone predators) feed on sea urchins, which graze on kelp forests.
- If sea otters are removed:
- Sea urchin populations explode (trophic cascade).
- Kelp forests are overgrazed and destroyed.
- The system may reach a tipping point where kelp cannot recover, leading to a new ecosystem dominated by urchin barrens.

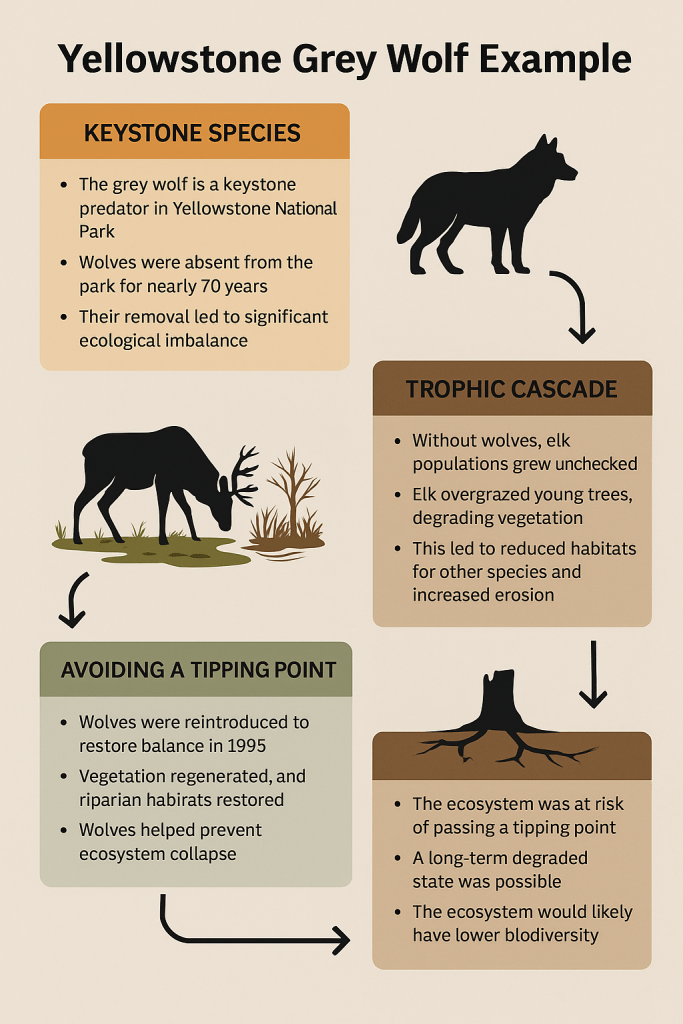
Case Study 2: Yellowstone grey wolf as a keystone species

- The grey wolf is a keystone predator in Yellowstone National Park.
- Before reintroduction in 1995, wolves had been absent from the park for nearly 70 years.
- Their removal led to significant ecological imbalance.
Trophic Cascade Triggered by Wolf Absence
- Without wolves:
- Elk populations grew unchecked (wolves are their natural predator).
- Elk overgrazed young willow, aspen, and cottonwood trees, especially near riverbanks.
- This overgrazing:
- Degraded vegetation.
- Reduced habitats for birds, beavers, and other species.
- Increased soil erosion and destabilized riverbanks.
Reintroduction and Ecosystem Recovery
- After wolves were reintroduced:
- Elk populations declined and changed their behavior—they avoided open valleys and riverbanks where they were more vulnerable to predation.
- Vegetation recovered in these areas (e.g. more willows and aspens grew).
- Beavers returned, building dams and creating wetland habitats.
- Songbirds, fish, and amphibians increased due to better habitats and water quality.
Avoiding a Tipping Point
- Without wolf reintroduction, the ecosystem may have passed a tipping point:
- Long-term degradation of vegetation.
- Permanent loss of key habitats and species.
- Shift to a less biodiverse and less stable ecosystem.
- Wolves helped restore balance, preventing the ecosystem from collapsing into an alternative degraded state.
Part 4: Tipping Points
Recall that a tipping point is the minimum threshold point that if a system reaches it, it will move away from its original equilibrium state to another (new) equilibrium state.
Tipping points result in the breakdown of the original ecosystem and the establishment of a new equilibrium. For instance, deforestation in the Amazon rainforest decreases water vapor production through transpiration, which in turn reduces the cooling and precipitation needed to sustain the remaining forest.
Measuring changes in an ecosystem due to human activity
Human impacts on ecosystems can include toxins from mining, landfill waste, and eutrophication. The changes in an ecosystem vary depending on the specific human activities involved. To accurately study the effects, the methods used to measure both abiotic and biotic components of the ecosystem must align with the type of human activity being examined. In your local area, there may be places where you can explore how human disturbance has impacted natural ecosystems, such as forests harvested for timber or grasslands frequently trampled by walkers.
Several methods can be used to study the effects of human activities, including:
- Conducting capture–mark–release–recapture studies on invertebrate species in both disturbed and undisturbed areas
- Measuring species diversity using Simpson’s reciprocal index
- Utilizing indicator species (HL)
- Measuring environmental variables like light levels, temperature, and wind speed. You could also calculate the average diameter of tree stems at breast height (DBH) and assess the degree of canopy openness (how much sky is visible through the forest canopy), providing insights into tree biomass (organic matter) and leaf cover.
- Assessing soil erosion, especially in areas with high rainfall, by measuring the depth of soil remaining around free-standing rocks and stones where surrounding soil has been eroded.
- Measuring soil variables such as structure, nutrient content, pH, compaction, and moisture levels.
Passing Biosphere Threshold
- Biosphere Integrity & Biodiversity Crisis: Ecosystem integrity and functioning, critical for maintaining biodiversity and preventing extinction, is assessed using the Biodiversity Intactness Index (BII). This index measures the average abundance of species compared to an intact ecosystem, across biomes and major marine ecosystems like coral reefs.
- Critical Threshold Passed: Changes in biosphere integrity have crossed a critical threshold, signaling urgent concern.
- Planetary Boundaries: The planetary boundaries model highlights the environmental ceiling, beyond which lies unacceptable degradation and potential tipping points in Earth systems. Biodiversity loss is one of these boundaries, and current evidence shows it has been breached.
- Extinction Rate (E/MSY):
- E/MSY (extinction per million species years) measures extinction rates. For example, at 1 E/MSY, one species would go extinct every year for a population of one million species.
- Background extinction for mammals is 1 E/MSY (one extinction per million species per year).
- Natural extinction rates for most animal groups range between 0.1 and 1 E/MSY.
- Current extinction rates are estimated to be 100–1000 E/MSY, which is 100–1000 times higher than the natural rate.
- BII Implications:
- 90% BII or more: Ecosystem remains resilient and functioning with sufficient biodiversity.
- Below 90% BII: Loss of biodiversity reduces ecosystem resilience.
- 30% BII or less: Severe biodiversity depletion, ecosystem collapse risk.
- Urgency: Human activity has disrupted ecosystems, causing significant loss of biosphere integrity. Extinction rates and the BII confirm that the planetary boundary for biosphere integrity has been crossed, signaling a dire need for action.

![ESS 8.1.3 [AHL] Biocapacity and Environmental Migration](https://mypytrclass.com/wp-content/uploads/2025/12/image-4.png?w=1024)


![ESS 8.3.4 [AHL] Photochemical Smogs and Tropospheric Ozone](https://mypytrclass.com/wp-content/uploads/2025/12/image-1.png?w=1024)