

Learning Objectives
- To acquire the skill in investigating soil texture by soil sedimentation test
- To analyse raw data of soil sedimentation test
Part 1: The Research Question
How does soil texture get affected in soil along a transect line from a river bank towards uphill?
- Independent variable:
- Distances of soil sampled along a transect line from a river bank. The distances are of each 10 metres
- Dependent variable:
- Soil texture measured by varied percentages of sand, clay and silt. This is tested by 1 hour-sedimentation test
- Controlled variable:
- Distance interval between soil samples
- Amount of soil sampled either measured in mass or volume
- Depth of soil being sample which is from top soil to 10 centimetres downwards
- Volume of water used in sedimentation test
- Duration of sedimentation test
- Uncontrolled variable:
- Soil component distribution along the transect and within one zone along the transect. This is part of the independent variable the uncontrolled distribution of biotic and abiotic factor may affect the pattern or trend shown by sand, silt and clay.
Part 2: Experimental
Safety Precautions
- Field trip to sample soil from a river bank should be done by and/or accompanied by experienced adult. Choose a river bank with flatter land profile rather than poached river bank that may cause accident.
- Consult the city council for any danger by wild animals.
- Avoid conducting this investigation in an area with safety warning such as (but not limited to) crocodile, snakes, beavers, heavy stream, possible landslide and so on
- Use gloves to avoid infection. The river and soil may be contaminated with pathogen or other toxic chemicals
Procedure
Sampling using transect
- Identify and visit the area of interest
- Use a transect tape to mark the straight line from the river bank shoreline towards the hill or forest. Mark every 10 metres starting 0 at the shoreline
- For every interval of 10 meters, sample approximately 30g of soil into a sampling bottle. Label the bottles according to their distances (this will later be divided into 3 – 5 trials)
- Repeat step 2 and step 3 by moving the transect line to another starting point in the same area. These steps may be repeated 3 to 5 times so that generalisation of the soil texture is not bias
Soil Sedimentation Test
- Transfer 10g of soil sample into a 250mL of centrifuge tube or transparent sampling bottle
- Add 100mL of dH2O and close the tube using its lid
- Shake the mixture vigorously for about 30 seconds
- Let the tube stand in a rack for 1 hour to separate the sand, silt and clay.
- Record the volume of the three layers separated (if you are using sampling bottle, record the height in cm, using a ruler)
- Use this sheet to organise your data
Part 3: Analysis and Conclusion
Use your data in this section. The following data is provided in case you did not get your result. The result is obtained from an investigation done in Sandakan, Sabah (in Malaysia)

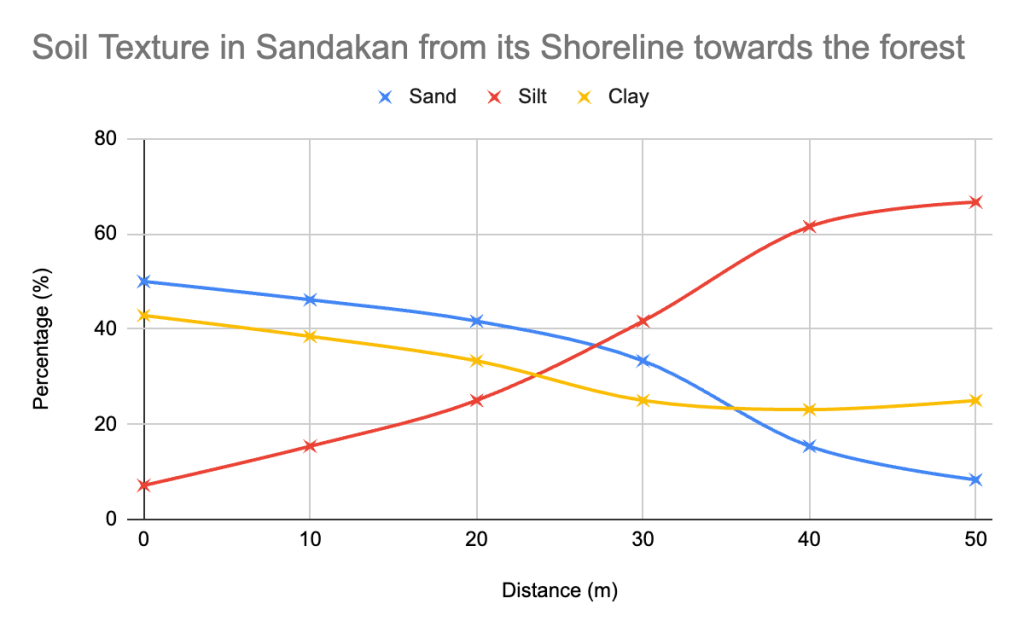
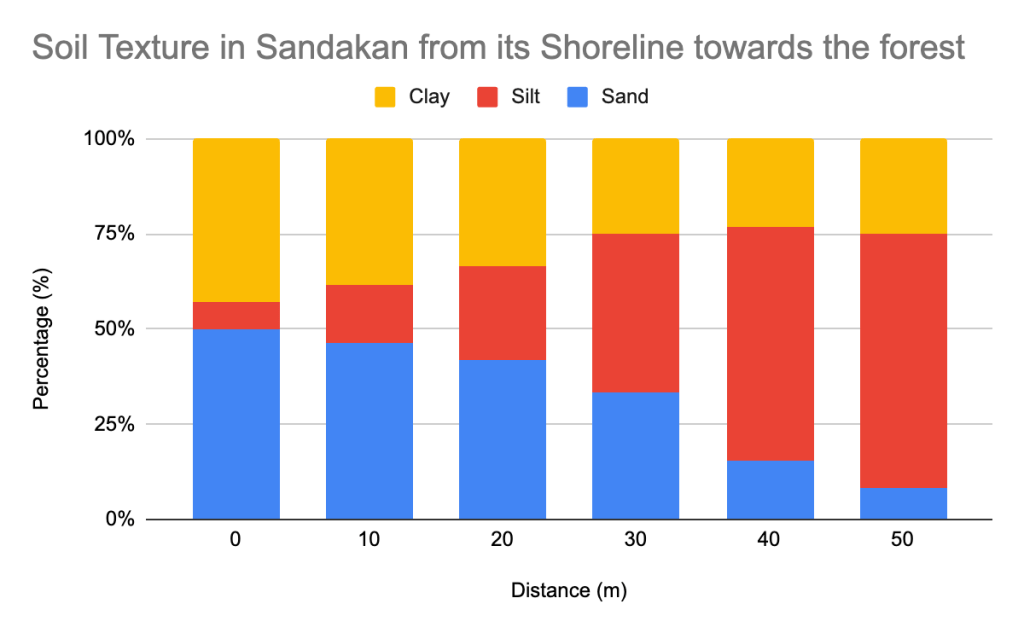
Interpretation
- Draw the soil triangle graph and place the soil correctly in the graph. Label your graph
- Describe the trends shown in the above graphs
- Explain the change in the soil texture along the transect lines
- Conclude the result
![ESS 8.1.3 [AHL] Biocapacity and Environmental Migration](https://mypytrclass.com/wp-content/uploads/2025/12/image-4.png?w=1024)


![ESS 8.3.4 [AHL] Photochemical Smogs and Tropospheric Ozone](https://mypytrclass.com/wp-content/uploads/2025/12/image-1.png?w=1024)