
Learning Objectives
- Define weather, climate and climate change
- Explain the correlation between CO2 and the change in atmospheric temperature
- Describe the climate change models
- Explain different perspectives on climate change
- [AHL] Describe further evidences of climate change
Abstract
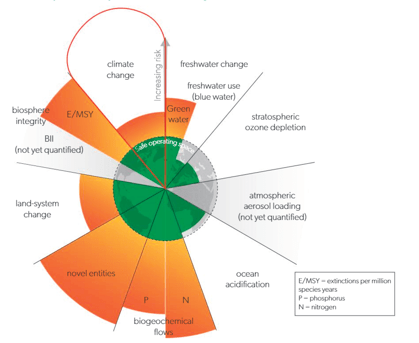
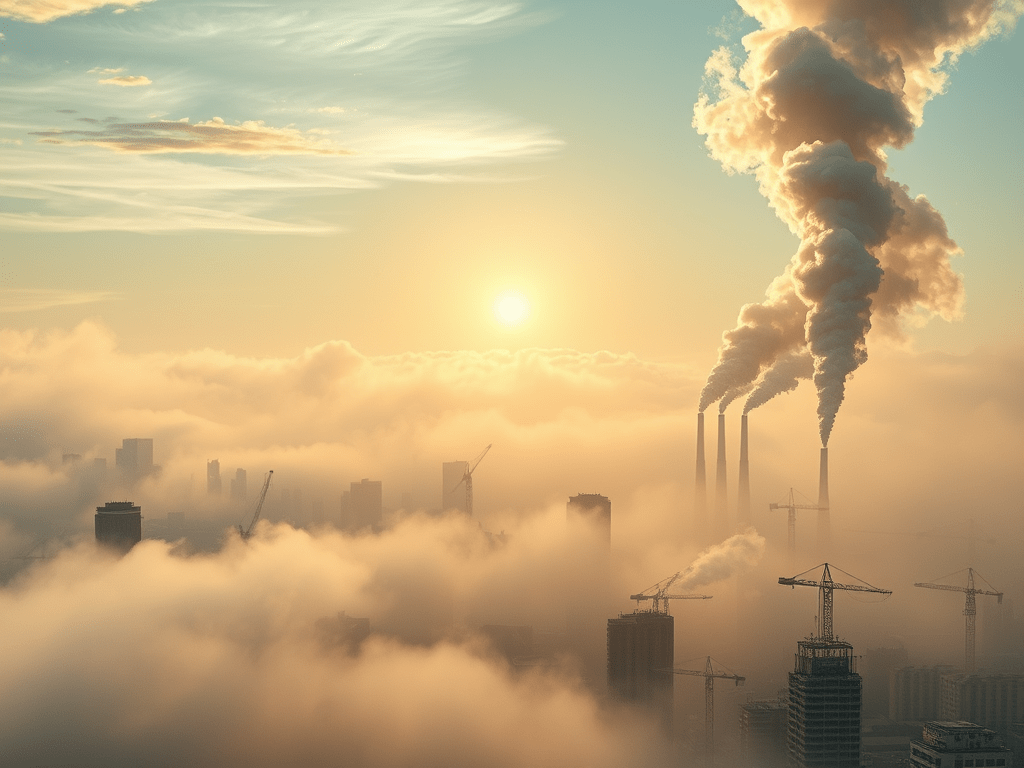
Climate is shaped by atmospheric physical processes, yet anthropogenic carbon dioxide emissions have driven a significant rise in atmospheric concentrations, with emission rates accelerating notably since 1950. Proxy records such as ice cores, tree rings, and sediments demonstrate a positive correlation between CO₂ levels and global temperatures, evidencing the enhanced greenhouse effect caused by human activities. This intensification has led to global warming and subsequent climate change, which undermines the resilience of ecosystems, drives biome shifts, and affects human societies across multiple scales and socio-economic contexts. Systems models and diagrams help illustrate the causal relationships, feedback loops, and shifts in the global energy balance associated with these processes. Current evidence suggests that the Earth has already surpassed the planetary boundary for climate change, and perspectives on its causes and consequences are shaped by a range of individual and societal factors.
Perspectives on Climate Change
Psychological research indicates that some individuals employ denial as a defense mechanism when confronted with climate change, as the issue is often perceived as too large or frightening to fully comprehend. Responses to climate change vary: some reject the existence of human-caused climate change entirely, while others acknowledge its occurrence but question the magnitude of the changes or the precise impact of human activities.
A survey conducted across the UK, Ireland, Norway, Poland, Italy, and Germany found that large majorities of respondents are concerned about the effects of climate change: on average, 81% expressed concern for future generations, and 80% for humanity in general. Most participants also believed that climate change is currently harmful or will become harmful within the next decade.
Public perceptions of scientific consensus on climate change are often inaccurate. Across the six surveyed countries, respondents estimated that 68% of scientists agree that human-caused climate change is occurring, considerably lower than the actual consensus of approximately 99.9%. There is also variation in beliefs regarding the causes of climate change: on average, 74% attribute it primarily to human activities, with country-specific figures ranging from 61% in Norway to 82% in Italy. Additionally, many people believe that oil companies are suppressing technologies that could enable vehicles to operate without petroleum-based fuels.
Individual and societal perspectives on climate change are shaped by multiple factors, resulting in ongoing debate over appropriate responses. One rationale for proactive mitigation of greenhouse gas emissions is cost-effectiveness: the expenses associated with preventative measures are likely to be substantially lower than those required for post-impact adaptation. For example, while coastal cities could theoretically be abandoned and reconstructed inland, improving energy efficiency and reducing emissions to limit sea-level rise is likely to be far more economical. Historical experience with anti-pollution programs demonstrates that preventing emissions is consistently more cost-effective than addressing the resulting damage.
Weather and Climate
Individual actions play a crucial role in addressing climate change and must complement government-led initiatives. Evidence demonstrates that collective efforts by individuals have already yielded positive outcomes, such as the reduction of single-use plastics, improvements in energy efficiency, greater reliance on renewable energy, the expansion of conservation and clean-up projects, and heightened accountability for corporate pollution.
At the individual level, everyday choices exert measurable influence on emissions. These include avoiding fast fashion, limiting unnecessary travel, reducing dependence on disposable plastics, and adopting more sustainable energy and dietary practices. Central to these behavioural shifts are the principles of reducing, reusing, repurposing, and recycling.
If such low-carbon lifestyles are adopted on a broad scale, the cumulative effect could significantly mitigate emissions and help prevent the most severe climate change scenarios projected by the Intergovernmental Panel on Climate Change (IPCC).
Weather
Daily outcome of interactions among temperature, air pressure, wind speed, precipitation, and humidity.
- Varies greatly between places, sometimes over very short distances.
- Forecasts are only reliable for about five days due to the complexity of interacting variables.
- Extreme single events (e.g., a hot day, cold day, or one unusual season) do not indicate long-term climate change.
Climate
The average weather pattern over approximately 30 years in a specific location. Long-term records reveal climate trends and shifts. Climate often operate on different timescales from weather but both are influenced by ocean and atmospheric circulation. Other factors include:
- Clouds: can trap heat or reflect sunlight away.
- Forest fires: emit CO₂ but regrowth can recapture it in carbon stores.
- Volcanic eruptions: release ash that cools the Earth temporarily (e.g., Mt. Pinatubo, 1990).
- Human activity: burning fossil fuels and livestock farming release greenhouse gases.
Climate Change
Long-term shifts in global or regional climate patterns. This may be naturally influenced by:
- Fluctuations in solar insolation.
- Milankovitch cycles.
- Changes in atmospheric gas composition from biological activity.
Carbon Dioxide and Temperature
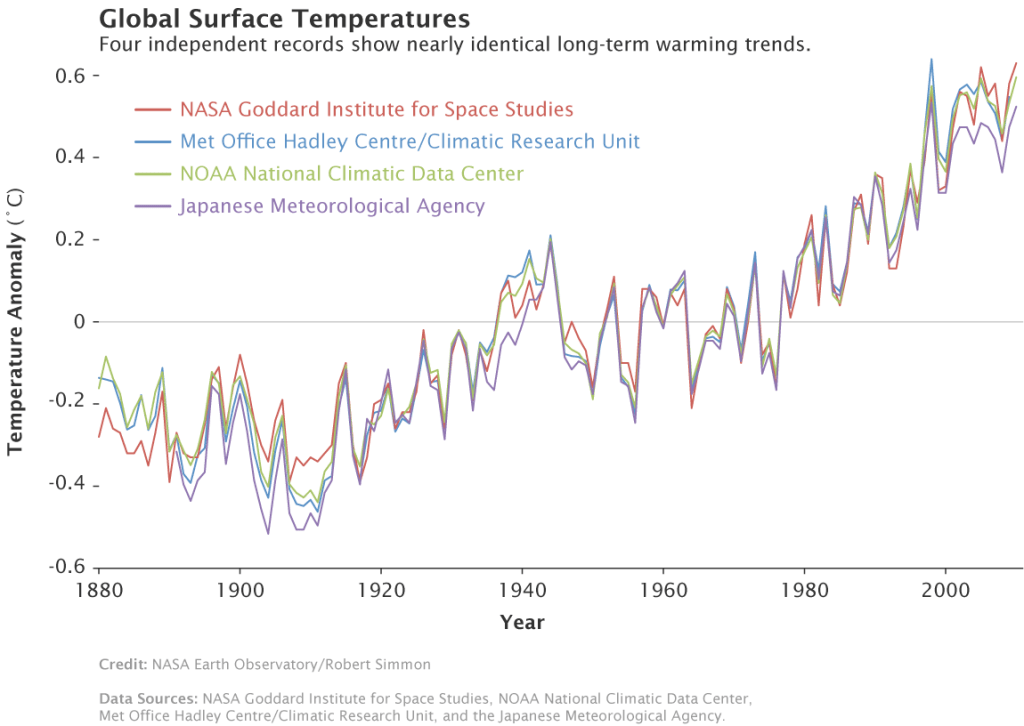
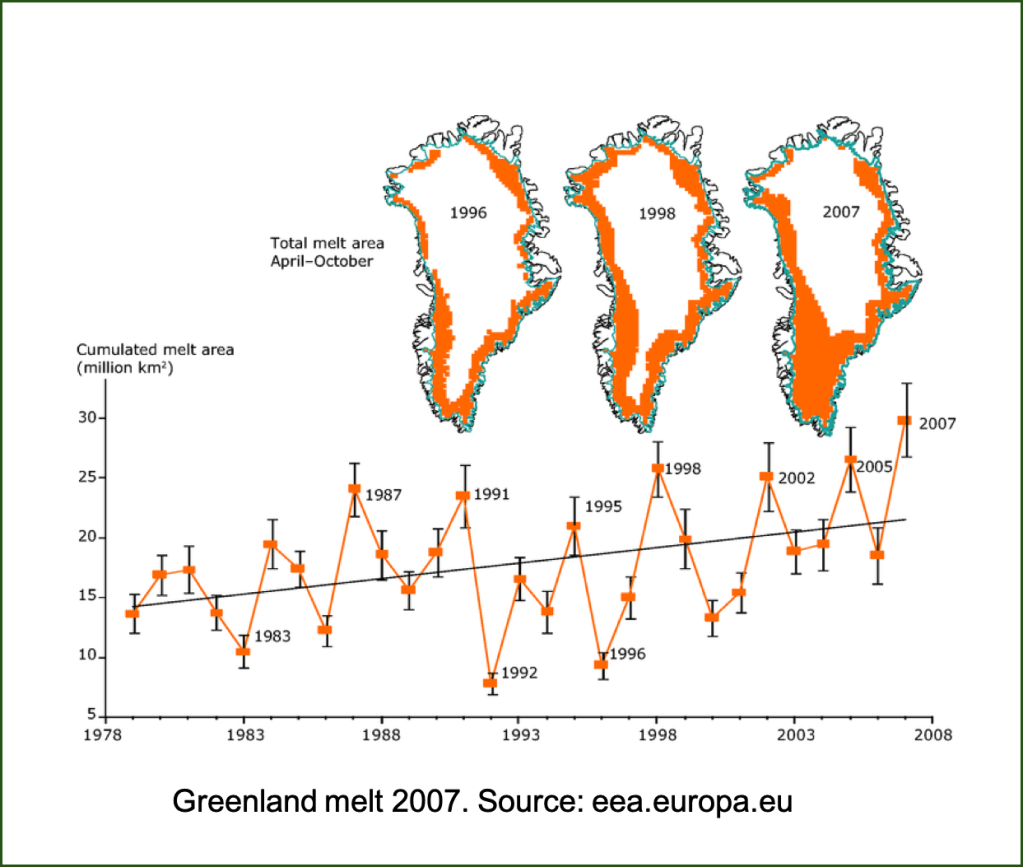
Global climate change occurs when the balance between energy inputs and outputs in the Earth’s system is altered, whether through increased heat input, decreased heat loss, or a combination of both. Greenhouse gases (GHGs) impede the escape of heat from the atmosphere, such that higher concentrations lead to enhanced heat retention. The climate system functions within a state of dynamic equilibrium, which can either maintain stability or shift to a new equilibrium if critical thresholds, or tipping points, are exceeded. Long-term observational records demonstrate a consistent increase in the Earth’s average surface temperature, despite interannual variability. This trend and its magnitude are corroborated by multiple independent datasets, including those from NASA, NOAA, Berkeley Earth, and national meteorological agencies in the United Kingdom and Japan.
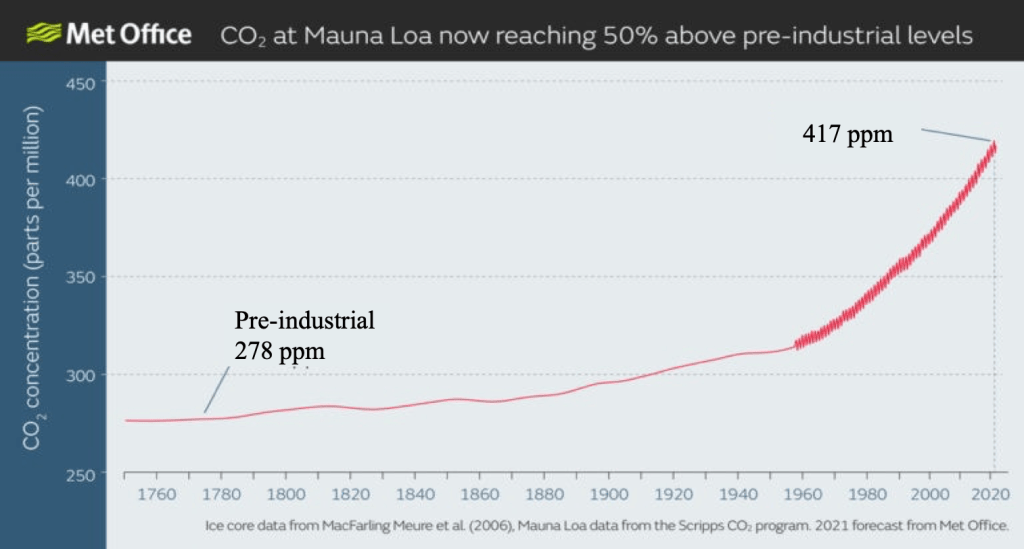
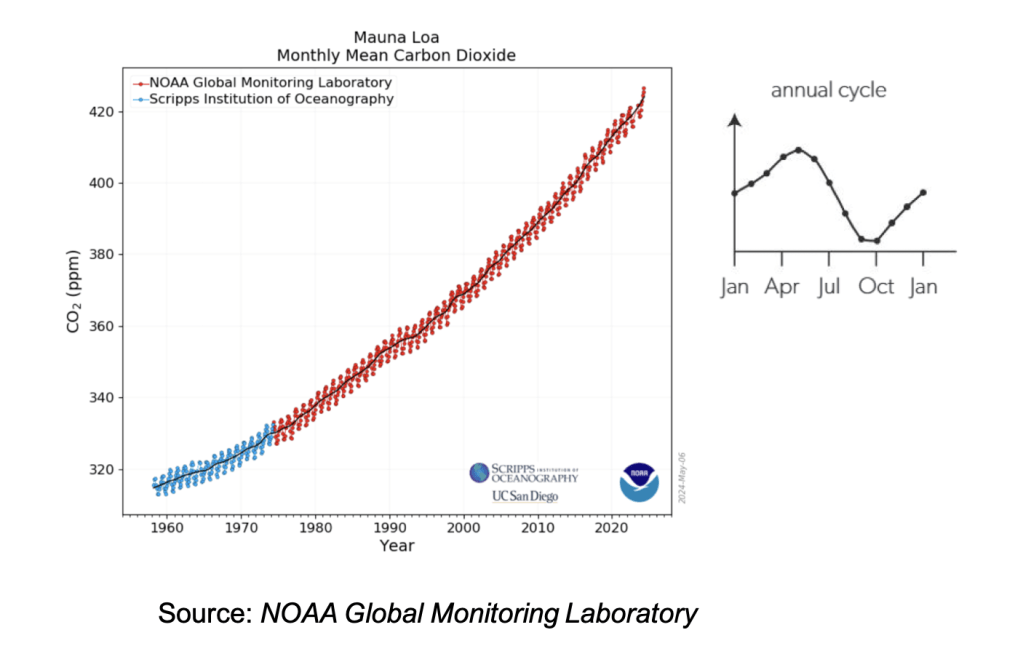
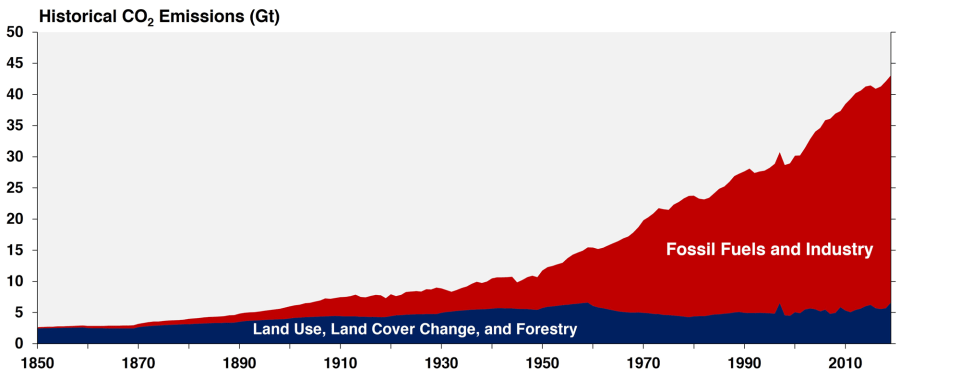
Anthropogenic carbon dioxide (CO₂) emissions have led to a substantial increase in atmospheric CO₂ concentrations. The global emission rate has accelerated markedly, particularly since 1950 (figure above). Although this rise originated during the Industrial Revolution in late 19th-century Europe, it intensified from the 1960s onward as industrialisation expanded and the extraction and combustion of fossil fuels increased. Seasonal and annual fluctuations in atmospheric CO₂ levels are observed (figure below), yet the overarching trend remains upward.
A strong positive correlation exists between atmospheric CO₂ concentrations and global temperatures (figures below). This relationship is supported by direct measurements dating back to approximately 1850 and by indirect proxies, including ice core analyses, dendrochronology, and sediment records, all of which consistently demonstrate a positive association between atmospheric CO₂ levels and global temperature.
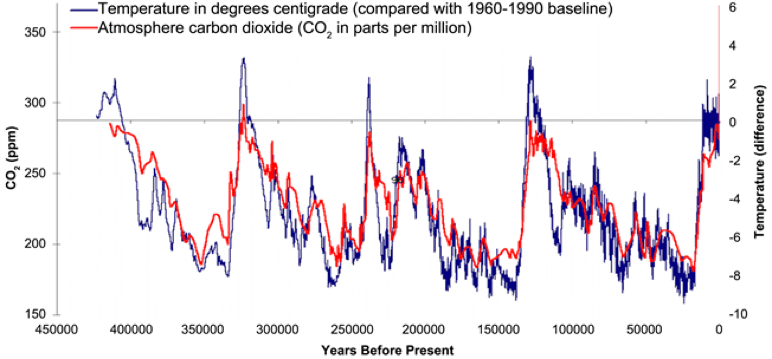
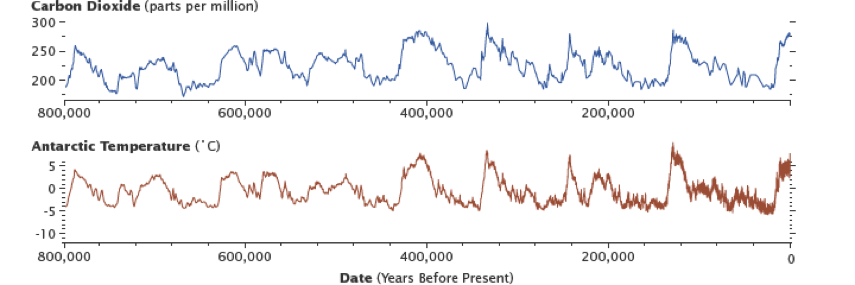
Atmospheric concentrations of CO₂ have exhibited a strong correlation with global temperature variations over the past 800,000 years. These fluctuations in temperature were primarily initiated by Milankovitch cycle-induced variations in Earth’s orbital patterns, which produced alternating glacial and interglacial periods. Rising global temperatures subsequently released additional CO₂ into the atmosphere, thereby amplifying warming through positive feedback mechanisms. Evidence from Antarctic ice core records demonstrates this long-term relationship until approximately 1900, at which point anthropogenic activities began transferring carbon from the slow carbon cycle to the fast carbon cycle, fundamentally altering the natural balance.
AHL Content: Further Evidences of Climate Change
Advancements in weather forecasting and climate prediction have been facilitated by data collected from satellites, weather stations, observatories, radar systems, and computerised data networks. These long-term datasets enable the study of climate change and alterations in land use, encompassing variables such as temperature and greenhouse gas concentrations. Climate models, which test hypotheses regarding complex systems, rely on such data. The accuracy and volume of data directly influence the precision and reliability of these models.
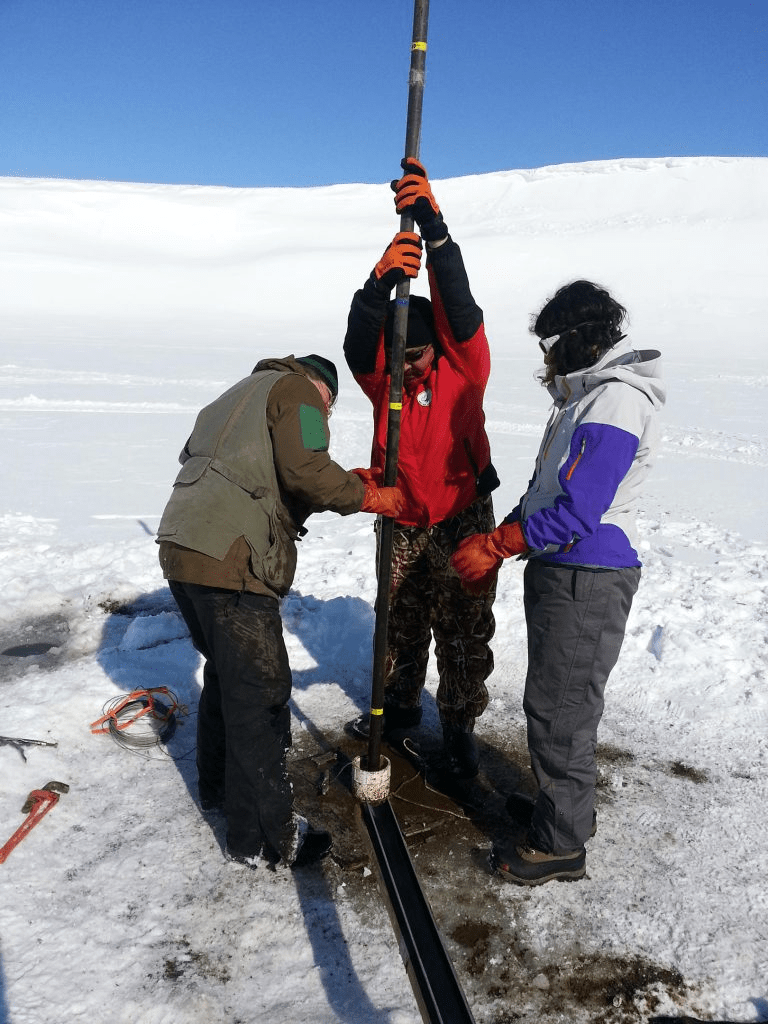
Climate measurements are classified as either direct or indirect (proxy) observations. Direct measurements provide information about current conditions, while indirect measurements allow the reconstruction of past climates. Both types of data are integral to the development and validation of climate models, with historical data enhancing model accuracy. Direct measurements include records of temperature, humidity, precipitation, air pressure, wind speed and direction, atmospheric gas concentrations, cloud formations, and pollution levels. Although direct atmospheric carbon dioxide measurements extend only to the 1950s, proxy data provide a long-term perspective on climatic changes.
Indirect measurements include ice cores, tree rings, sediment cores, fossilised organisms, and pollen preserved in peat and lake sediments. Together, these direct and proxy datasets provide robust evidence for historical and ongoing climate change, supporting the reliability of modern climate models.
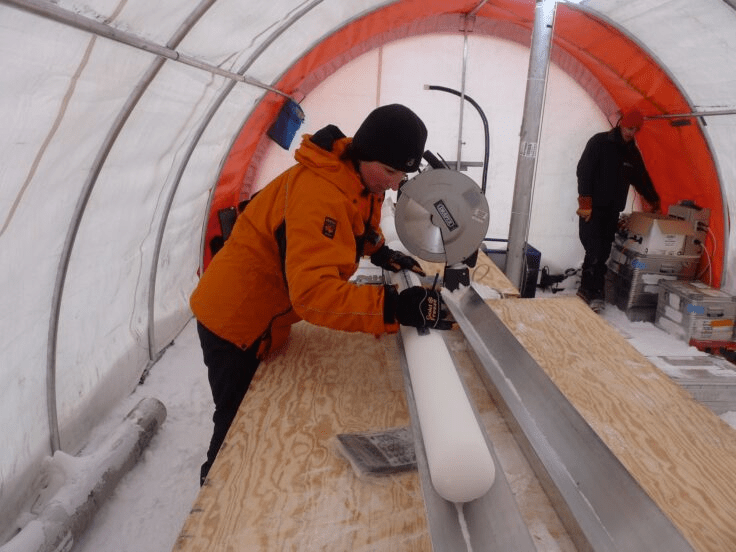
Ice Cores
- Carbon dioxide concentrations remained stable at approximately 280 ppm for the past 10,000 years.
- Levels began to rise in the early 19th century with the onset of coal combustion during the Industrial Revolution.
- By February 2023, atmospheric CO₂ reached 417 ppm, while methane concentrations have more than doubled relative to pre-industrial levels.
- Antarctic ice cores reveal glacial-interglacial cycles of approximately 100,000 years, with CO₂ concentrations lower during glacial periods and higher during warmer interglacials.
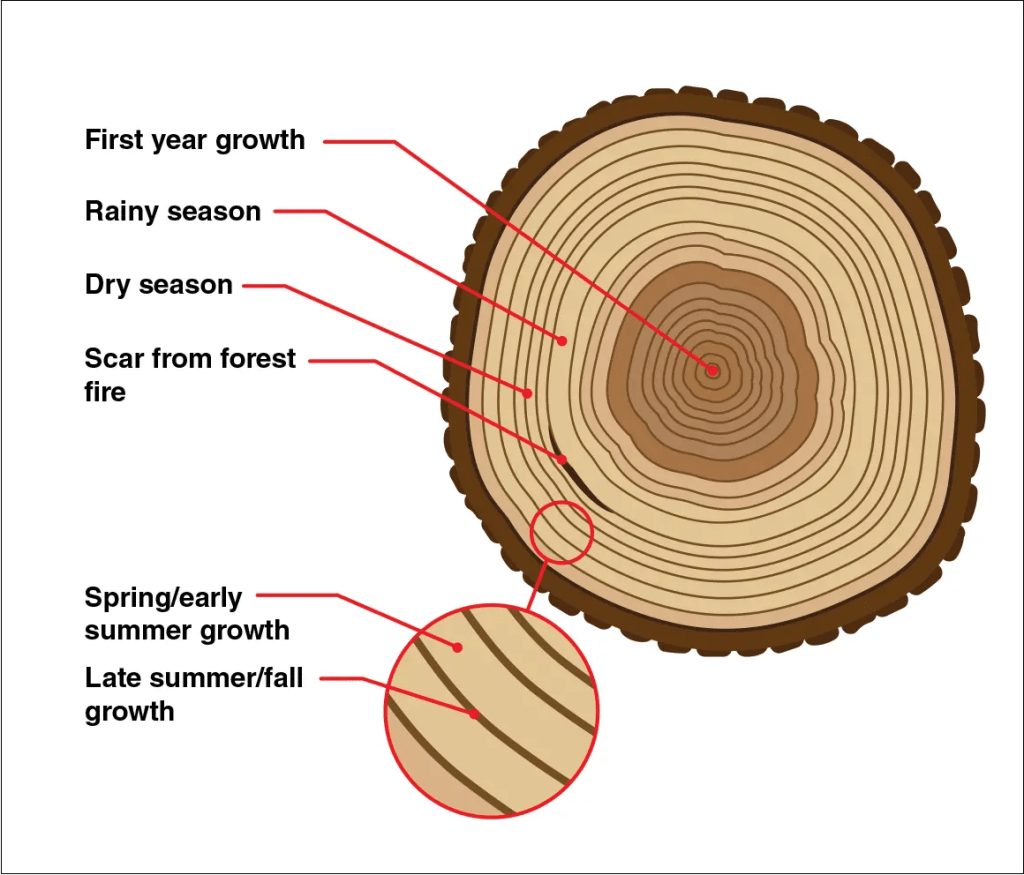
Tree Rings
- Trees, some living over a millennium, record annual growth in concentric rings.
- Growth depends on sunlight and water, with warmer temperatures generally promoting faster growth.
- Rings laid down during summer have larger cells, while winter rings are smaller, producing a visible annual pattern.
- Analysis of tree rings through coring or felling allows reconstruction of both tree age and historical climate conditions.
Pollen and fossil analysis
- Pollen and fossils preserved in peat bogs, lake sediments, and rock strata provide long-term ecological records.
- Pollen deposited in sediments reflects the vegetation present at the time of deposition, while fossilised organisms and pollen can be dated to reveal past environmental conditions.
End of AHL Content
Modelling Climate Change
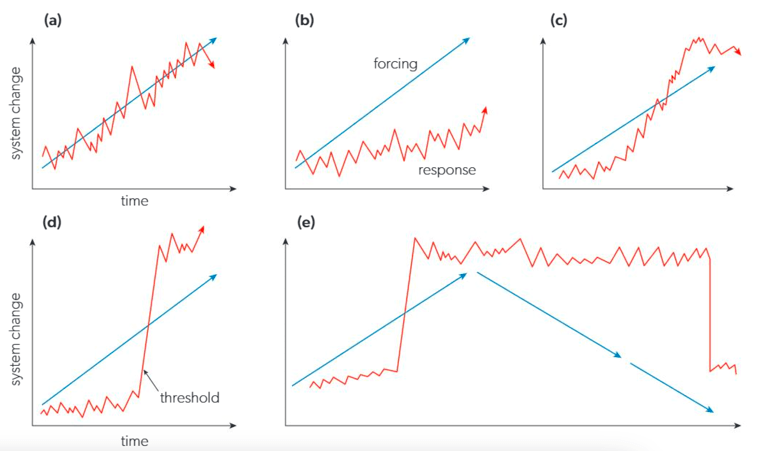
Can you match the description with the graph?
| Description | Graph |
| Delayed acceleration to a new equilibrium: The climate may initially respond slowly, then accelerate as positive feedbacks dominate, eventually reaching a new equilibrium. | |
| Hysteresis or locked-in states: Once a threshold is crossed, the climate may remain at the new equilibrium even if forcing decreases, only shifting rapidly again if another threshold is surpassed. Such changes can occur over short timescales, potentially within a few decades. | |
| Direct positive feedback: Increases in solar radiation, reductions in surface albedo, or enhanced methane release can amplify climate change through positive feedback loops. | |
| Threshold or tipping point behaviour: The climate may remain relatively stable until forcing reaches a critical threshold, after which rapid change occurs until a substantially higher equilibrium is established. | |
| Buffering or insensitivity: In some cases, climate forcing may increase, but the climate response is non-linear, exhibiting relative insensitivity or being moderated by negative feedback mechanisms. |
Carbon Cycles
Anthropogenic emissions of greenhouse gases (GHGs) have intensified the natural greenhouse effect. Human activities have introduced substantial quantities of carbon dioxide (CO₂), methane (CH₄), and nitrous oxide (N₂O) into the atmosphere, alongside smaller amounts of other GHGs, contributing to global warming and climate change. In the absence of human influence, carbon stored in fossil fuels is released gradually into the atmosphere through volcanic activity over millions of years via the slow carbon cycle. The combustion of coal, oil, and natural gas significantly accelerates this process, releasing each year vast amounts of carbon that accumulated over geological timescales. In 2009, anthropogenic activities, including fossil fuel combustion and cement production (the latter accounting for up to 8% of CO₂ emissions), contributed approximately 8.4 billion tonnes of carbon to the atmosphere. Roughly half of these emissions are sequestered annually by the fast carbon cycle, while the remainder persists in the atmosphere.
Current atmospheric concentrations illustrate the scale of this impact: CO₂ now accounts for approximately 417 molecules per million, the highest concentration in two million years. Methane levels have risen from 715 parts per billion (ppb) in 1750 to 1,895 ppb in 2021, representing the highest concentration in at least 650,000 years. Methane possesses a global warming potential substantially greater than that of CO₂. Rates of CO₂ increase have also accelerated over time: in the late 1960s, atmospheric CO₂ was rising at roughly 1 ppm per year, increasing to 2 ppm per year by the early 21st century, and reaching nearly 2.5 ppm annually over the past decade. Although these increments may appear modest, their cumulative effect on the climate system is considerable.
Economic Gains and Losses from Climate Change
Climate change is expected to produce both economic gains and losses across national economies. Agricultural productivity may increase in higher-latitude regions but is likely to decline in tropical areas. In Africa, reductions in food production and rainfall are anticipated, with regions such as Northern Darfur already experiencing extensive desertification; millions of additional hectares may be affected in the future. Conversely, extraction of fossil fuels and minerals in higher-latitude regions may become more feasible due to changing environmental conditions.
Quantifying the economic impacts of climate change is challenging. The Stern Review (2006), led by the former Chief Economist of the World Bank, estimated that allocating approximately 1% of global GDP to climate change mitigation could prevent potential economic losses of up to 20% of global GDP in future recessions. Current projections of the overall cost of global climate change by 2050 range between USD 14 trillion and USD 23 trillion, though substantial uncertainty remains regarding the precise figures.
Planetary Boundary
Paris Agreement targets:
- Limit global temperature increase to below 2°C above pre-industrial levels
- Aim to keep temperature rise ideally below 1.5°C
Basis for temperature limits:
- Global temperature targets are calculated based on atmospheric CO₂ concentrations
- The safe threshold for CO₂ is below 350 ppm
Current status:
- The atmospheric CO₂ concentration has already exceeded 350 ppm
- This indicates that the boundary set by the Paris Agreement has been crossed
![ESS 8.1.3 [AHL] Biocapacity and Environmental Migration](https://mypytrclass.com/wp-content/uploads/2025/12/image-4.png?w=1024)


![ESS 8.3.4 [AHL] Photochemical Smogs and Tropospheric Ozone](https://mypytrclass.com/wp-content/uploads/2025/12/image-1.png?w=1024)