Learning Objectives
- Outline GCMs
- Outline hindcasting method
- Describe different climate change scenarios using SSP
- Describe the aspects in inequity and vulnerability to climate change
Abstract
Global climate models (GCMs) are sophisticated computational tools that simulate the Earth’s climate system by manipulating input variables and applying mathematical equations to represent the physical processes and interactions that drive climate dynamics. The reliability of these models is commonly evaluated through hindcasting, a method that compares simulated outputs with historical climate records to assess predictive accuracy. To explore future possibilities, climate models incorporate a range of scenarios that project potential impacts of climate change under varying assumptions about emissions, policy interventions, and socioeconomic conditions.
Model outputs suggest that the Earth’s climate may be approaching critical thresholds, or tipping points, beyond which abrupt and potentially irreversible shifts to new equilibrium states could occur. Such transitions may also manifest in local or regional systems, where individual tipping points can interact and trigger tipping cascades—a sequence of self-reinforcing changes within the broader climate system.
Moreover, climate change impacts are distributed unequally across the globe. Nations differ significantly in both their contribution to greenhouse gas emissions and their vulnerability to climate-related risks. Those least responsible for driving climate change are often the most exposed to its adverse effects. These disparities underscore the political, economic, and ethical challenges inherent in addressing climate change, particularly regarding issues of equity, responsibility, and adaptation capacity.

Expanded Discussion on Climate Models
Climate models, often referred to as General Circulation Models (GCMs), are sophisticated computational tools developed from extensive long-term datasets. These models simulate the complex interactions within the Earth’s climate system by manipulating various input parameters and applying mathematical equations that represent the underlying physical processes governing atmospheric, oceanic, and terrestrial dynamics.
The reliability of climate models is commonly evaluated through a process known as hindcasting. Hindcasting involves testing a model’s accuracy by comparing its simulated outcomes with historical climate observations. For example, a model may be initialized with climatic conditions from 1950 and run forward for several decades to assess how closely the simulated results align with recorded data over that period. In essence, this process verifies whether the model can accurately reproduce known climatic trends and variations.
If the hindcast results diverge significantly from historical observations, the model requires refinement to improve its accuracy. Conversely, if the model successfully replicates observed climate patterns, it is considered more robust and its projections of future climate scenarios are deemed more credible.
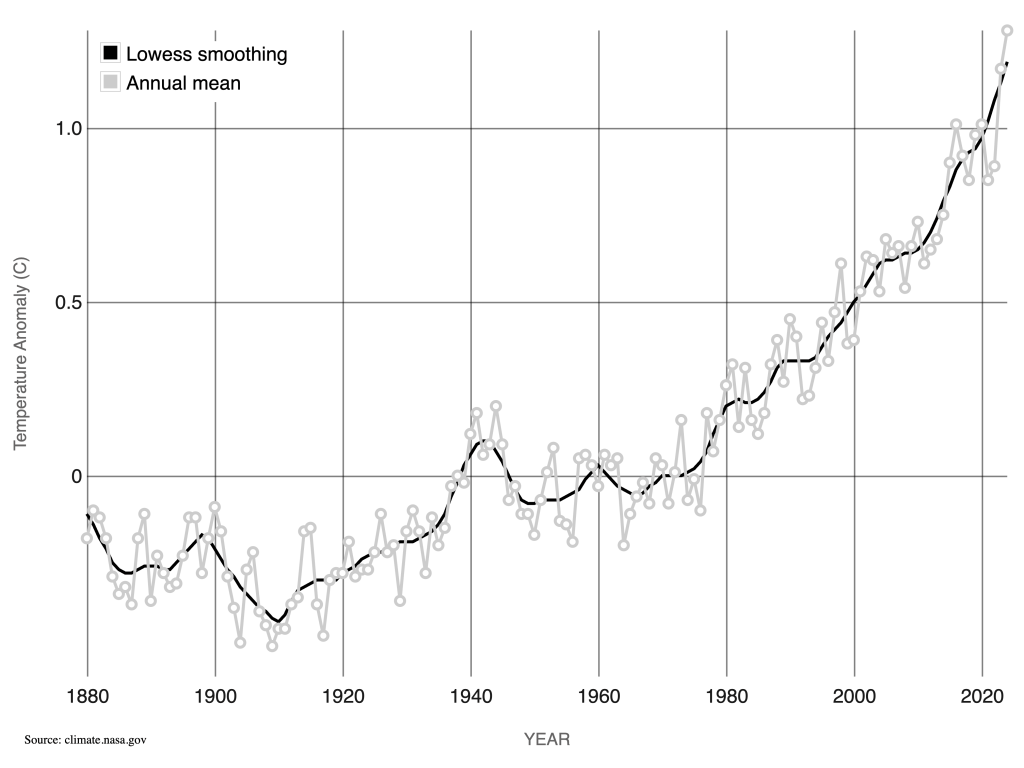
Although modern climate models demonstrate high levels of precision, no model can provide absolute certainty. Current models are built upon well-established physical principles of Earth system science and have shown considerable predictive skill. Notably, even models developed over five decades ago successfully forecasted the observed global temperature increase of approximately 0.9°C since 1970, underscoring their enduring scientific validity.
Climate Change Scenarios
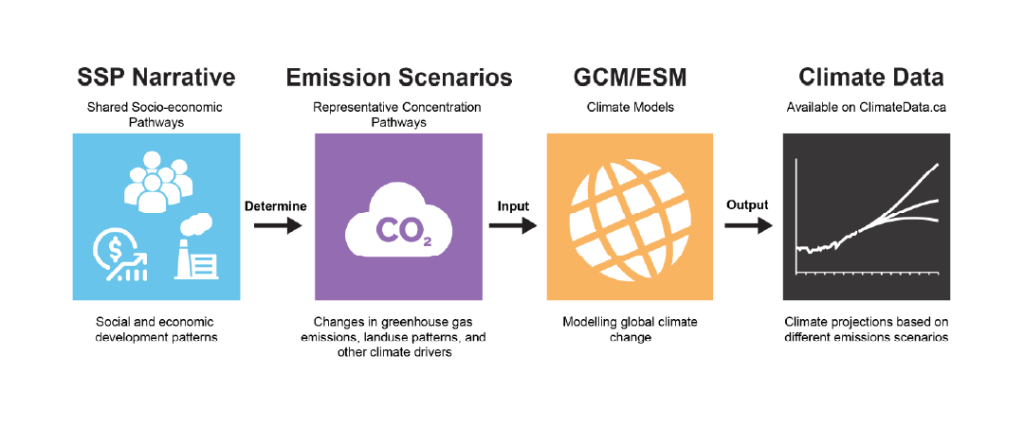
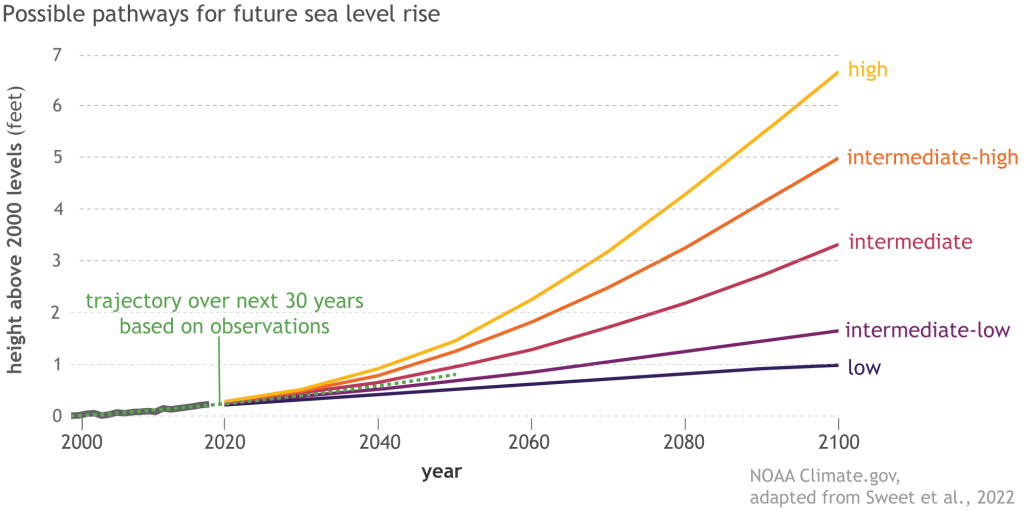
The future of the Earth’s climate remains uncertain, yet it is not entirely unknowable. Climate models employ a range of scenarios—structured narratives and data-driven projections—to explore potential impacts of climate change under varying assumptions about future socio-economic conditions, technological developments, and policy interventions. These scenarios help scientists and policymakers understand how different pathways, such as continued high emissions or significant mitigation efforts, may influence future climate outcomes. Graphical representations of such scenarios often depict alternative projections for temperature, population, and other variables, reflecting the inherent uncertainty about how global systems may evolve.
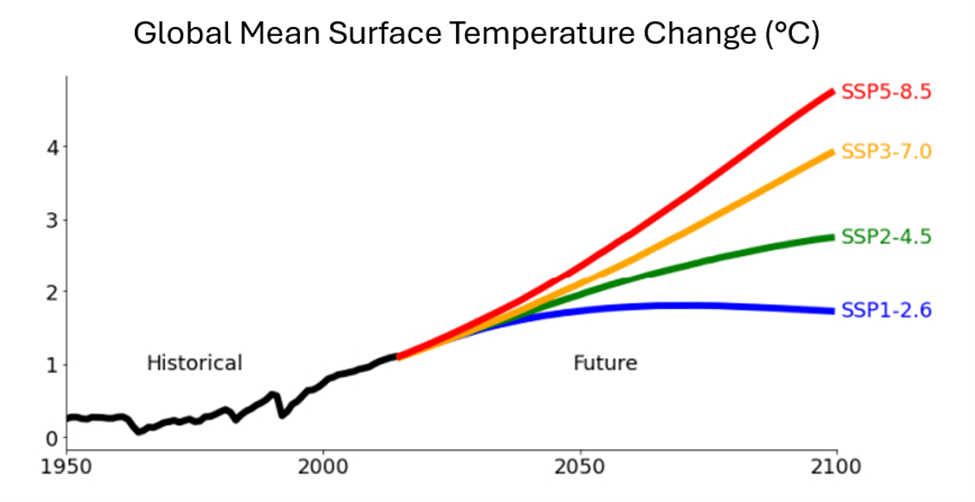
Climate change projections typically include a baseline or “business-as-usual” scenario, which assumes no major policy intervention, alongside various pathways that represent differing levels of emissions reductions. A key example concerns global temperature rise and sea level change. As oceans warm, the water expands, causing sea levels to rise—a process that is difficult to predict precisely but increasingly well understood. The Intergovernmental Panel on Climate Change (IPCC, 2019) projected a global sea level rise of approximately 0.6 to 1.1 metres by 2100, equivalent to about 5 millimetres per year, under a high-emission scenario. In the worst-case conditions, sea levels could increase by as much as 5 metres by 2300. Conversely, if nations significantly reduce their greenhouse gas emissions, the projected rise by 2100 decreases to between 0.3 and 0.6 metres.
While temperature change often dominates public and scientific discourse, alterations in global precipitation patterns are equally important. Climate change is expected to influence the distribution and intensity of rainfall and snowfall across regions, though these projections are subject to greater uncertainty due to the complex interactions within atmospheric systems. Warmer conditions are likely to increase evaporation and surface drying, potentially exacerbating regional disparities. In general, wet regions are projected to become wetter, while dry regions may experience further drying. The tropical Pacific and high-latitude regions are expected to see increases in precipitation, particularly affecting countries such as India, Bangladesh, Myanmar, and northern China. In contrast, the Mediterranean basin and southern Africa are projected to experience reduced precipitation, alongside declines in southwest Australia near Perth, southern Chile, the west coast of Mexico, and parts of the tropical and subtropical Atlantic Ocean.
The following table shows countries expected to be under water by 2100
| Number of People | Countries |
|---|---|
| <100,000 | Chile, Kenya, Namibia, Papua New Guinea, Portugal, Sweden |
| 100,000–499,000 | Australia, Canada, Colombia, Madagascar, Mexico, Tanzania |
| 500,000–999,000 | Ecuador, France, Italy, Mozambique, Pakistan, Turkey |
| 1–9 million | Brazil, Egypt, Germany, Japan, Myanmar, Nigeria, Philippines, UK, USA |
| 10–50 million | China, India, Indonesia, Thailand, Vietnam |
| No data | Bolivia, Botswana, Greenland, Kazakhstan, Mongolia |
Climate Tresshold
The observed rise in global temperatures over the past 150 years has prompted concern that the Earth may be nearing critical thresholds, or “tipping points,” within the climate system. A tipping point represents a threshold beyond which rapid, self-reinforcing, and potentially irreversible changes occur, pushing the system into a new and unstable state. These changes are often driven by positive feedback mechanisms that amplify initial disturbances. Current evidence suggests that some regions may have already approached or crossed such thresholds, including the Antarctic ice sheet, the slowing of the Atlantic thermohaline circulation, and the transitional zone between the Amazon Rainforest and the Cerrado savannah.
Furthermore, the interconnected nature of the Earth’s climate system raises the risk of “tipping cascades,” in which one tipping event increases the likelihood of another, producing a domino effect. For instance, thawing permafrost can lead to the dieback of boreal forests, releasing large quantities of greenhouse gases that further intensify warming and contribute to sea level rise. Similarly, the loss of the Greenland ice sheet could destabilize the West Antarctic ice sheet through the intrusion of warm seawater, potentially leading to significant sea level rise and a weakening of the Atlantic thermohaline circulation. These non-linear processes amplify uncertainty in predicting the pace and magnitude of climate change. It is important to distinguish these phenomena from trophic cascades, which occur in ecological systems when predators indirectly affect lower trophic levels through population control.
Inequity and Vulnerability to Climate Change
Climate change also raises critical issues of inequity and vulnerability. While nations differ in their contribution to global greenhouse gas emissions, their capacity to cope with climate impacts varies significantly. The countries least responsible for emissions are often the most vulnerable to their effects, highlighting the moral and political dimensions of climate governance. During the 2022 United Nations Climate Change Conference (COP27) in Egypt, debates centred on financial responsibility for addressing loss and damage caused by climate change. The G77 coalition and China, representing 134 low-income countries, argued that all developing nations should be eligible for compensation. In contrast, the European Union contended that financial assistance should prioritise the most vulnerable states. The resulting agreement to establish a Loss and Damage Fund marked a significant milestone, though its operational details remained under development as of 2023.
Vulnerability to climate change encompasses three interrelated dimensions: the degree of physical exposure to risks such as floods, storms, droughts, heatwaves, and sea level rise; the social and demographic characteristics of populations at risk; and the capacity of nations to respond through financial, technical, and institutional means. For example, Australia faces recurrent floods and wildfires but possesses substantial resources and expertise to manage these hazards effectively. Conversely, many developing countries may lack the adaptive capacity to respond adequately even if current exposure levels are relatively low. The IPCC (2022) identified global hotspots of high human vulnerability in West, Central, and East Africa, South Asia, Central and South America, small island developing states, and the Arctic. These disparities underscore the need for equitable climate policies that account for both historical responsibility and differential adaptive capacities across regions.
![ESS 8.1.3 [AHL] Biocapacity and Environmental Migration](https://mypytrclass.com/wp-content/uploads/2025/12/image-4.png?w=1024)


![ESS 8.3.4 [AHL] Photochemical Smogs and Tropospheric Ozone](https://mypytrclass.com/wp-content/uploads/2025/12/image-1.png?w=1024)