
IA Planning Template
Criterion A Stands – RQ and Inquiry
This criterion assesses the extent to which the student establishes and explores an environmental issue (either local or global) for an investigation and develops this issue to state a relevant and focused research question. Full 4 marks of criterion A may be achieved by:
- providing an explanation of a local or global environmental issue and,
- stating a focused research question that directly addresses the selected topic.
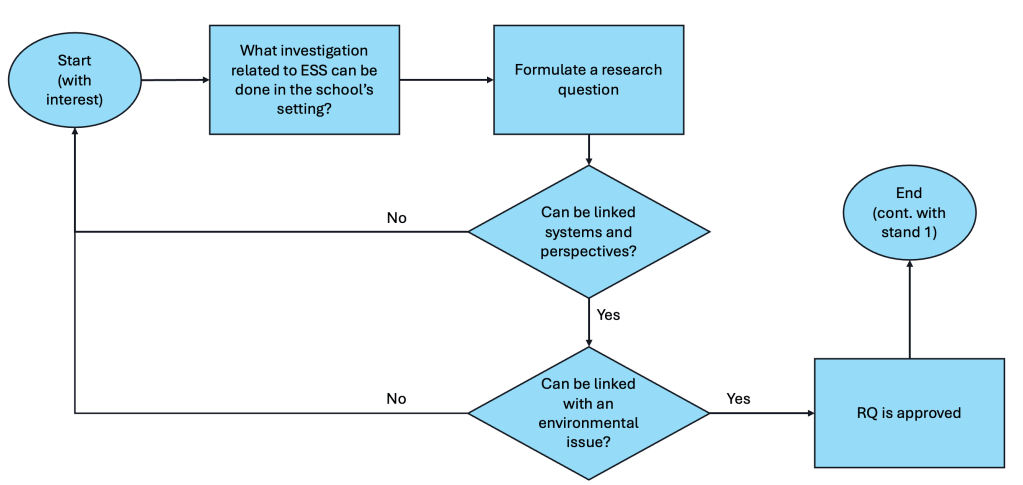
Depending on their reasoning process, students may choose to begin with either the explanation of the issue or the development of the research question. Click the following images to enlarge and see the steps for each approach.

It is crucial that both the environmental topic and the research question are appropriate for an ESS internal assessment. Investigations that focus solely on human health, economic factors, or narrow aspects of biology or geography are generally unsuitable. For example, an investigation into the effect of light colour on photosynthesis would fall under biology, while an analysis of the correlation between GDP and electricity consumption would be classified as economics or geography. However, topics that effectively integrate these disciplinary perspectives within an environmental context may be appropriate. An example of a suitable and well-integrated focus would be an investigation into the relationship between electrical supply and demand in relation to proposed offshore wind farming, and its associated environmental and social impacts on coastal communities (IBO).
If you begin with the environmental issue, the background research should include either relevant theoretical frameworks or models being explored, or a literature review of existing academic studies. This foundational research supports the development of a clear and focused research question and informs the identification of key variables. Broad or descriptive accounts of environmental topics are unlikely to achieve high marks; for instance, a general review of atmospheric carbon dioxide levels would be considered too superficial. A stronger investigation would involve a specific analysis of the Keeling Curve for carbon dioxide and the models used to predict future changes.
Strand 1: Explaining Environmental Issue
Students often score low due to a lack of understanding of the environmental issue and its cause-and-effect explanations. They also tend to focus too heavily on describing patterns and observable details rather than addressing the underlying reasoning, mechanisms, and cause–effect relationships. The table below summarises the distinction between “describe” and “explain.”
| Aspect | Describing an Environmental Issue | Explaining an Environmental Issue |
|---|---|---|
| Focus | Outlines what is happening. | Examines why or how it is happening. |
| Purpose | Provides factual information and observable details. | Provides reasoning, mechanisms, and cause–effect relationships. |
| Approach | States characteristics, patterns, or trends without deeper reasoning. | Connects concepts, processes, and evidence to show understanding of underlying causes. |
| Example | “Global temperatures have risen by approximately 1.1°C since pre-industrial times, leading to melting ice caps and rising sea levels.” This statement describes the situation by giving data and observations. | “Global temperatures are rising because increased concentrations of greenhouse gases, such as carbon dioxide and methane, trap more heat in the atmosphere through the enhanced greenhouse effect.” This statement explains the issue by identifying causes and mechanisms. Note that for the actual IA report, this explanation would require more details using the concepts in ESS |
Stand 2: Stating a focused Research Question
Your research question (RQ) needs to be unique to you and must address the chosen environmental issue. If you are working in a group, your teacher will check that both your question and your background research are clearly your own. This ensures your internal assessment (IA) is original and personal to your work. It’s important to explain in your background research how your dependent variable links to your investigation and to justify the range of your independent variable. In most cases, you’ll explain this in your background section rather than in the question itself.
Your RQ must include variables. In most cases, these will be:
- an independent variable (the one you change), and
- a dependent variable (the one you measure).
Make sure the range for your independent variable is realistic and relevant. For example, when studying how temperature affects algae growth due to ocean warming, remember that the hottest ocean surface temperature (in the Red Sea) is about 32°C. Choosing a range up to 50°C would be unrealistic and show a weak understanding of the topic. Sometimes, you might use a derived variable (a value calculated from other data), or you may look at how two variables are correlated.
- In an experiment, you change the independent variable to see how it affects the dependent (or derived) variable.
- In a correlation, you don’t change anything — you simply explore the relationship between two variables. For example, you could compare GDP and access to safe water between countries.
Remember that correlation does not mean causation. Just because two variables are related doesn’t mean one causes the other. Claiming cause without evidence will reduce your marks.
Avoid research questions that are too ambitious or vague. Your investigation must be manageable within the available time, data, and word limit. Also, stay away from unclear words like “efficient” or “suitable” unless you can define exactly what they mean in your context.
FAQs
How many people should I sample if I conduct a survey investigation?
If you are doing a survey to compare a variable in different group, each group requires 30 samples. Which means, with 5 measurements of independent variable, you will need at least 150 samples, equally divided into the 5 groups.
Can I do an investigation that has only a little link to the environmental issue?
Limited or lack of link between RQ and environmental issue does not mean that you cannot do the investigation. However, you will get mark deduction. Also note that all investigation must be of ESS nature. You cannot investigate and write report that is heavily formatted as Biology, Geography or Chemistry only.
Can I use simulation that gives a processed data?
If you’re using simulations, the data might be a rate or other calculated value. All data collected from the simulator will be considered as raw data. For example, a simulation could produce rates of algae growth or water pollution levels. In this case, those rates would be your raw data. This means that you will have to further process this into your processed data or visual representation to answer your research question
Does a research question have to be in a form of a question?
In most cases, yes. However, your research question does not have to be written as a question — it can also be a clear statement that shows what you are investigating. For example, when comparing the biodiversity of two areas in a national park, where one area has a higher frequency of visitors than the other, the research question could be expressed as a statement. For instance:
“A comparison of the impact of visitor numbers on biodiversity in two areas of National Park X.”
This format makes it clear what you’re comparing and what data you’ll need to collect.
What happens if my topic is too broad?
If your background information is too broad or lacks detail, you won’t reach the top marks for this section. You may include more than one independent variable, but only if they are clearly linked and you can still explore them in depth within the word limit. This will result in low score due to either unable to reach depth within the first 3000 words or lacks of focus and depth to cover all strands in all criteria.
Is providing a hypothesis a must?
No, it is not required nor it is assessed. If you still decide to include this, the hypothesis should not be in the form of the null and alternative hypotheses unless for statistical analysis. If null and alternative hypotheses are included, this must be addressed in the conclusion.
Criterion B Stands – Strategy
This criterion assesses the extent to which students understand how tensions between perspectives can impact the environmental or societal outcomes of a strategy that addresses an issue central to the student’s investigation. To score the total of 4 marks in criterion, a student should:
- describe an existing or developing strategy that addresses an environmental issue linked to the research question
- explains a tension between different perspectives (economic, social, cultural, political or environmental) that results from the strategy
Strand 1: Describing Strategies
A range of strategies is described that addresses an environmental topic/issue. This must be explicitly linked to the research question. Students are not allowed to create their own strategies in addressing the environmental topic/issue. Which means, all described strategies must be existing or developing in the local or global context. Some strategies may be general and should not be left without full description if included. For example, “implementing a new law” is too broad. This should be described in the context of the environmental issue in a localised area.
A strategy is a plan, action, or management approach designed to help solve or reduce an environmental issue. It can focus on something local, like actions in your community, or be broader, depending on your topic. Local strategies could include examples shown in photos, posters, brochures, or community pamphlets. For instance, a community project to protect a nearby forest could connect to a research question about deforestation and climate change.
Stand 2: Explaining Tensions
Tensions happen when there is disagreement, conflict, or imbalance between people, groups, or communities who have different views or goals about a strategy. These differences might come from ethical, political, religious, cultural, economic, or practical (real-world) perspectives. For this part of your work, make sure the perspectives you choose clearly show a position or opinion about the strategy. This will allow you to explain and discuss the tensions between them. To sum:
- a tension (or tensions) that arises from the strategy when viewed from different perspectives is discussed
- the discussion includes at least two contrasting worldviews/perspectives on a stated tension
- the discussion includes the arguments used by each perspective regarding its potential outcomes
- a personal perspective on the stated strategy is included.
For example, imagine the government creates a national park to protect wildlife and habitats. This decision might cause tension between the government and the local (indigenous) community living inside the new park boundaries. In your report, you should include:
- A summary of each side’s position — what the government wants (for example, to conserve biodiversity) and what the local community wants (for example, to continue living and using the land as they always have).
- The reasons for and against the strategy from both perspectives, showing how each one connects to the outcomes of the strategy. For instance:
- The local community might ignore new rules about entering or using resources in the park.
- Tourism could lead to damage or disrespect of cultural or religious sites.
- The community might start small businesses for park visitors.
- The government might offer jobs in the park to local people.
- The government could fine or arrest locals who enter restricted areas.
- Your own personal reflection on the issue. End with a short conclusion that states your stance and summarises your thoughts on the tensions you discussed.
FAQs
Do I need to describe strategies that is the same as the RQ or investigation?
The environmental issue or strategy you discuss doesn’t have to be the same one you investigate in your research, but it must be clearly linked and relevant to your research question.
How do I “explain” tensions?
Students should discuss the tension between at least two different perspectives or worldviews related to the strategy they are studying. For each perspective, include the following:
- A short summary of that perspective’s argument or position on the environmental issue.
- An explanation of how that perspective views the strategy — for example, whether they support or oppose it, and why.
- A discussion of the possible effects of this tension on the success of the strategy, including both positive and negative impacts.
- Finally, include your own personal viewpoint on the issue and the strategy.
Criterion C Stands – Method
This criterion assesses the extent to which the student has developed an appropriate and repeatable method to collect data that is relevant to the research question. The data could be primary or secondary, qualitative or quantitative. The full 4 marks of criterion C can be achieved by:
- describing a repeatable method.
- providing a method that allows for the collection of sufficient data to answer the RQ
Strand 1: Describing a repeatable method
The methodology should be written not as a proposed plan, but rather something that has been done. A repeatable method means that someone else could follow your steps and get similar results. To make your method repeatable, you need to include enough details for another person to clearly understand and replicate your investigation. Your description should include:
- How the investigation was set up, including what you did personally (although this should be written in academic writing).
- The sampling or surveying techniques you used.
- How you collected your data.
- Details such as:
- The location where the fieldwork took place
- Any surveys or questionnaires used
- How participants were chosen for surveys
- Website details if you used an online database
- Materials, sampling kits, probes, and any reagents or solutions (with their concentrations, if relevant)
- The exact method used to measure your variables (for example, how you measured plant growth or counted leaves)
- The range and intervals of your independent variables
- How often you collected data (sampling rate or frequency)
- How you established control variables or conditions
- Correct use of scientific terms (minor spelling mistakes are fine if the meaning is clear)
- Proper formatting for scientific names
- Any sketches, diagrams, charts, or photos used to illustrate your investigation, with clear scales and labels
- Screenshots showing how you collected data if your investigation used databases or simulations.
If your investigation only summarises information from other sources (a purely literature-based study) and doesn’t include your own data collection, it cannot be considered repeatable.
For most wet-lab investigation cases, you could use this checklist:
- Identify variables (although you don’t have to do this again if you have done this in Criterion A section)
- List of apparatus and materials
- Sampling method and sample preparation
- Would be advantageous to include any photographs, diagrams or screenshots
- Experimental (step-by-step procedure)
- the protocols should be cited but not copied verbatim; for example, there is no need to describe in detail the Winkler method for determination of dissolved oxygen. However, the steps that you did must be described in details
- Safety precaution and other environmental and ethical concerns
Stand 2: A method that allows collection of sufficient and relevant data
Your method should clearly show that it can produce the right kind of data to answer your research question. The type, amount, and number of repeated measurements (replicates) should be suitable, and your data collection process should be clearly explained. For this strand, there are to important aspects to look at:
- Can your data answer the RQ?
- Do you have sufficient data to answer the RQ?
It’s important to collect replicate observations and multiple samples because these systems are complex and naturally variable. As a general rule, you should aim for at least five measurements of your independent variable, with five repeats for each one.
For example, if you are studying how a storm drain affects dissolved oxygen levels in a stream, you might choose five sites — one above the drain and four below it. At each site, you would take five samples, giving you a total of 25 data points (5 × 5). This “5 × 5 rule” is a good guideline for most lab experiments and many field investigations.
In some field studies, like transect investigations, it might not be possible to collect that much data due to time limits or access issues. If that happens, you should explain your limitations clearly in your report.
For survey-based research, make sure you have enough participants to get meaningful results. A good rule of thumb is 30 participants per group. For instance, if you’re investigating how age affects attitudes toward recycling, you should aim for at least 30 people in each age group.
FAQs
Can I collaborate or use shared class data for a larger ecological study?
Yes. It’s fine to use shared class data to ensure you have enough replicates for analysis, as long as your investigation remains individual. Fieldwork can often be done more efficiently in groups, but each student must have their own unique research question and sampling method. For example, a group might all study the effect of a city on river water quality, but each student could focus on a different dependent variable, such as pH, nitrate levels, or turbidity.
I am studying by surveying the change in EVS in different generations using age groups. Each group is has 5 years and each group has 10 participants. Is this OK?
The age group is good such that you have 5 age groups. The number of participants for each group however is not sufficient. For each group, you need at least 30 participants.
![ESS 8.1.3 [AHL] Biocapacity and Environmental Migration](https://mypytrclass.com/wp-content/uploads/2025/12/image-4.png?w=1024)


![ESS 8.3.4 [AHL] Photochemical Smogs and Tropospheric Ozone](https://mypytrclass.com/wp-content/uploads/2025/12/image-1.png?w=1024)