Learning Objectives
- Outline the volume and and composition of solid waste
- Describe the global solid waste patterns
Composition & Volume of Solid Waste
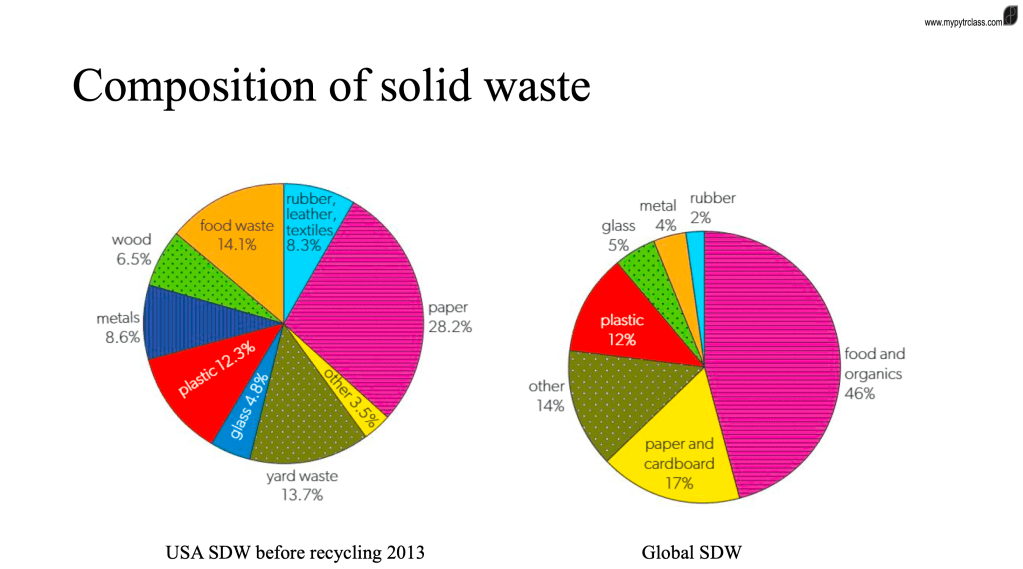
Composition of Waste
The composition of solid domestic waste varies spatially and temporally. Global averages conceal important differences between countries.
For example, while India produces nearly 50 million metric tonnes more food waste than the United States, the per capita figures differ: the United States generates 59 kg per person per year, compared to 50 kg per person per year in India. Similarly, China produces 10,129 million tonnes of e-waste annually, compared with 6,918 million tonnes in the United States; however, per capita production is only 7.2 kg in China versus 20 kg in the United States.
Waste generation patterns also depend on local conditions. In many low-income countries, large proportions of food are lost during harvesting, storage, and transportation due to inadequate infrastructure. The Food and Agriculture Organisation (FAO) estimates that nearly 40% of India’s food waste arises before consumption. Natural disasters—such as floods, droughts, and storms—also contribute to waste generation.
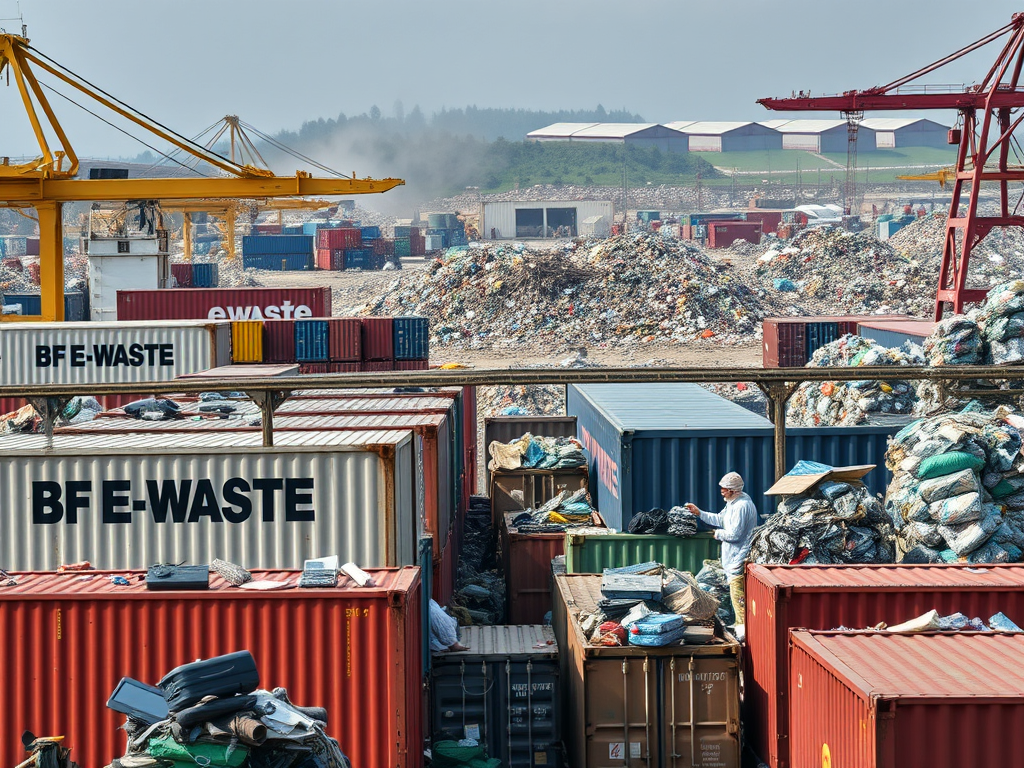
Moreover, waste is subject to international trade, moving between countries for treatment, recycling, or disposal. Hazardous and toxic wastes are often exported from HICs to LICs. E-waste, in particular, is transported legally and illegally across borders, which complicates national accounting of waste generation.
These dynamics explain the variations in both the composition and volume of waste among countries. The factors influencing the quantity of waste produced also shape its material composition and environmental impact.
Global Solid Waste Patterns
Volume and Composition of Waste
According to data from the 2018 World Bank report, the global average waste generation is approximately 0.74 kilograms per capita per day. However, this figure varies considerably across countries, ranging from 0.11 to 4.54 kilograms per capita per day, depending on national circumstances.
In general, higher levels of urbanization and income correlate with increased waste generation. In 2016, it was estimated that 2.01 billion tonnes of municipal solid waste were produced worldwide. This figure is projected to rise to 3.40 billion tonnes by 2050 if current trends continue.
The total waste output in low-income countries (LICs) is expected to more than triple by 2050, driven by population growth and urban expansion. Currently, the East Asia and Pacific region accounts for the largest share of global waste generation (23%), whereas the Middle East and North Africa region contributes the smallest share (6%) in absolute terms.
Recyclable materials constitute a significant portion of global waste streams. In low-income countries, recyclables—such as paper, cardboard, plastic, metal, and glass—represent approximately 16% of total waste, compared with about 50% in high-income countries (HICs). As nations experience economic growth and transition to higher income levels, the proportion of recyclables in waste streams increases, with paper waste showing the most notable rise.
Volume
Table 1: HICs producing most and least waste per year, 2018-2020
| HICs Producing Most Waste (kg per capita per year) | HICs Producing Least Waste (kg per capita per year) |
|---|---|
| Denmark – 850.6 | Japan – 336.9 |
| USA – 810.9 | South Korea – 413.0 |
| Luxembourg – 795.2 | Turkey – 419.7 |
| New Zealand – 781.1 | Canada – 423.6 |
| Iceland – 735.1 | UK – 456.7 |
Causes of the Global Increase in Waste Generation
The steady global rise in waste generation can be attributed to several interrelated social, economic, and technological factors:
- Population Growth
- An expanding global population naturally results in higher volumes of waste production as more individuals consume resources and generate refuse.
- Urbanisation
- Increasing urbanisation leads to higher population densities and greater access to consumer goods. Urban residents generally purchase more items, contributing to higher levels of household and commercial waste.
- Technological Advancement
- Rapid technological progress has transformed product design and packaging practices. Historically, items such as milk and soft drinks were sold in reusable glass containers that were returned, cleaned, and refilled. In contrast, modern packaging—predominantly plastic—is often non-biodegradable and disposable, significantly adding to the waste burden.
- Rising Standards of Living
- As income levels and purchasing power increase, individuals tend to consume more goods and services, resulting in greater waste generation.
- Changing Consumer Habits
- The growth of online shopping has increased the demand for packaging materials. The convenience of e-commerce means that consumers can order almost any product for home delivery, which typically involves additional packaging and, consequently, more waste.
- Cultural and Aesthetic Values
- In many societies, material possessions, appearance, and the use of modern technology are seen as indicators of social status. This consumer culture promotes a “throwaway society,” where products are frequently replaced rather than repaired or reused, especially when they become outdated or unfashionable.
Regional Differences in the Rate of Waste Growth
Studies that the rate of increase in waste generation varies by region. North America and Europe & Central Asia are experiencing a comparatively slower growth rate. Several factors may explain this trend:
- The implementation of environmental regulations that mandate the recycling of certain materials rather than their disposal as waste.
- The availability and application of advanced recycling and reprocessing technologies.
- Growing public awareness and social pressure to minimise resource wastage and reduce the environmental impacts associated with waste disposal.
- Corporate initiatives aimed at reducing packaging waste; for example, Coca-Cola bottling partners now produce bottles made entirely from recycled polyethylene terephthalate (rPET).
Composition
The composition of waste exhibits both spatial and temporal variation, similar to fluctuations in waste volume.
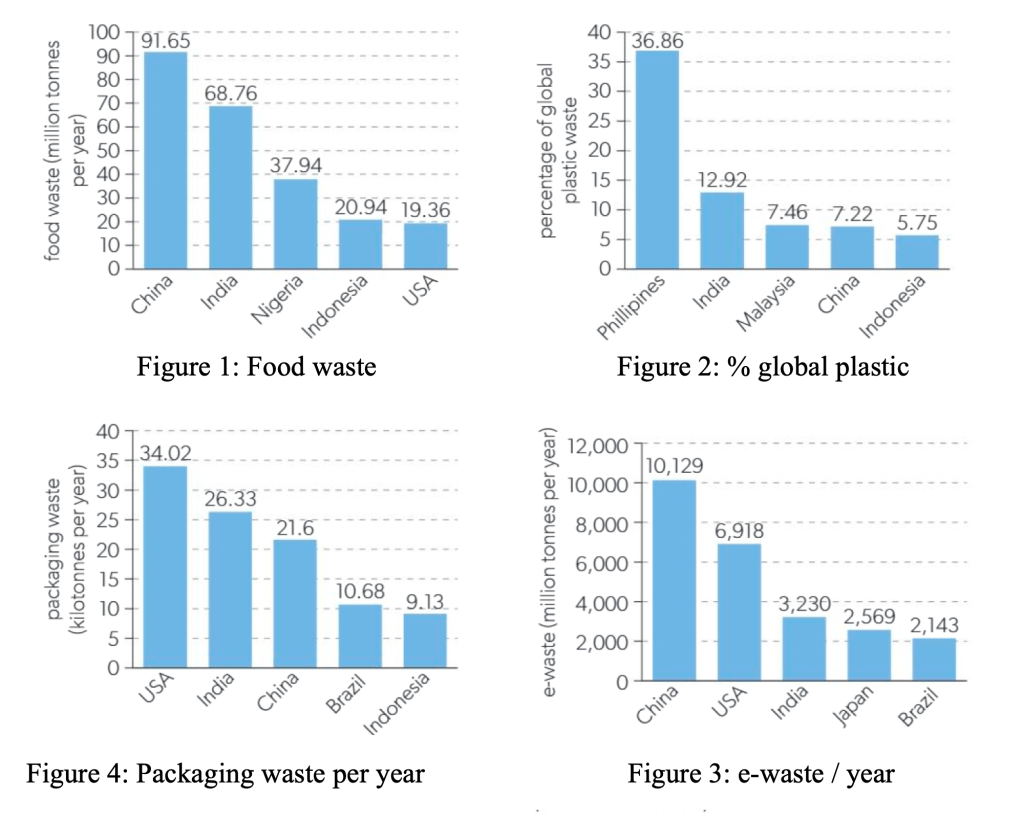
Caution must be exercised when interpreting such charts, as several contextual factors can distort comparisons. Population size and per capita waste generation are particularly important considerations. For instance, India generates approximately 50 million metric tonnes more food waste than the United States; however, when assessed on a per capita basis, the relationship reverses—food waste in the United States amounts to 59 kg per person per year, compared to 50 kg per person per year in India. A similar pattern is observed in electronic waste (e-waste): China produces 10,129 million tonnes annually, compared with 6,918 million tonnes in the United States, yet per capita figures show the inverse trend—7.2 kg per person in China versus 20 kg per person in the United States.
The location and causes of waste generation also vary significantly. In many low-income countries (LICs), a substantial portion of food waste arises from inefficiencies in agricultural harvesting, storage, and transportation systems. The Food and Agriculture Organisation (FAO) estimates that nearly 40% of food wasted in India results from these pre-consumption losses. Additionally, natural events such as floods, droughts, and storms can contribute to waste generation, particularly in the agricultural sector.
Waste composition is further influenced by international trade in waste materials. Waste is often transported across national boundaries for treatment, recycling, or disposal. Hazardous and toxic waste is frequently exported from high-income countries (HICs) to LICs for disposal. Similarly, e-waste is traded legally and illegally between nations, meaning that data presented in global waste composition figures may not accurately represent the origin of the waste.
Overall, the composition of waste differs between countries due to a combination of economic, infrastructural, and environmental factors. Moreover, the determinants affecting waste volume—such as consumption patterns, income levels, and industrial activities—also shape the nature and composition of the waste produced.
Notes and Class Activity
Subscribe to get access
Read more of this content when you subscribe today.
![ESS 8.1.3 [AHL] Biocapacity and Environmental Migration](https://mypytrclass.com/wp-content/uploads/2025/12/image-4.png?w=1024)


![ESS 8.3.4 [AHL] Photochemical Smogs and Tropospheric Ozone](https://mypytrclass.com/wp-content/uploads/2025/12/image-1.png?w=1024)