Learning Objectives
- Explain the concept of water quality, including its chemical, physical, and biological characteristics
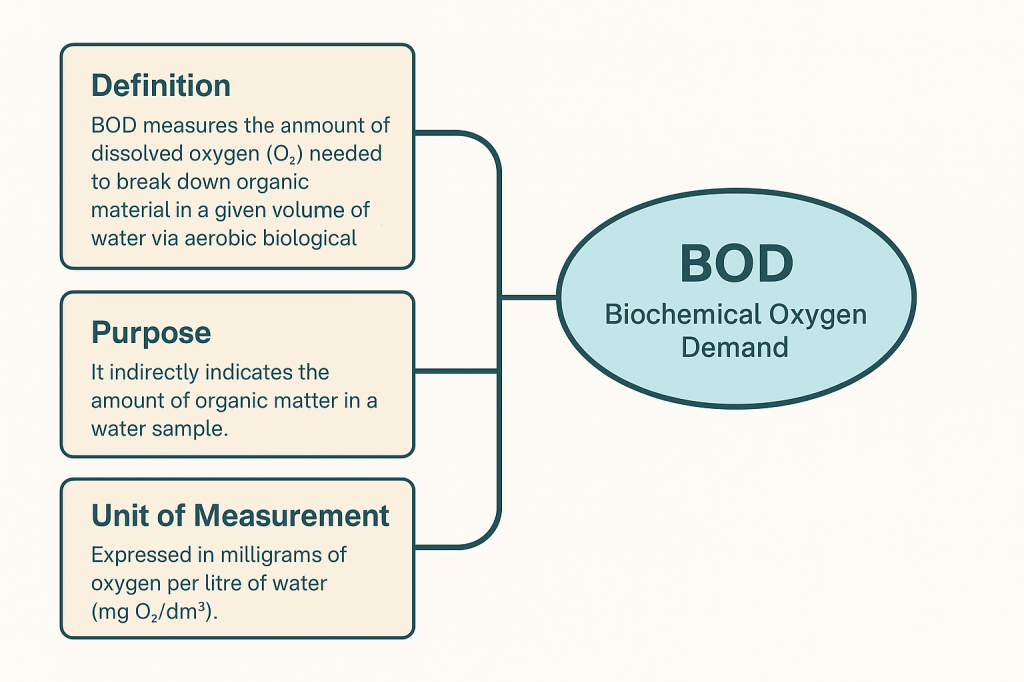
- Define biochemical oxygen demand (BOD) and interpret its significance in assessing water pollution.
- [AHL] Outline and analyse how water quality is measured using a Water Quality Index (WQI).
- [AHL] Summarise the drinking water quality guidelines set by the WHO and compare them to local standards.
Part 1: Water Quality Assessment
Water quality monitoring in freshwater systems involves assessing:
- Dissolved oxygen (O₂)
- pH levels
- Temperature
- Turbidity (clarity)
- Concentrations of nitrates, phosphates, specific metals, and total suspended solids
Purpose of data collection:
- To inform and guide management strategies for reducing pollution in aquatic environments
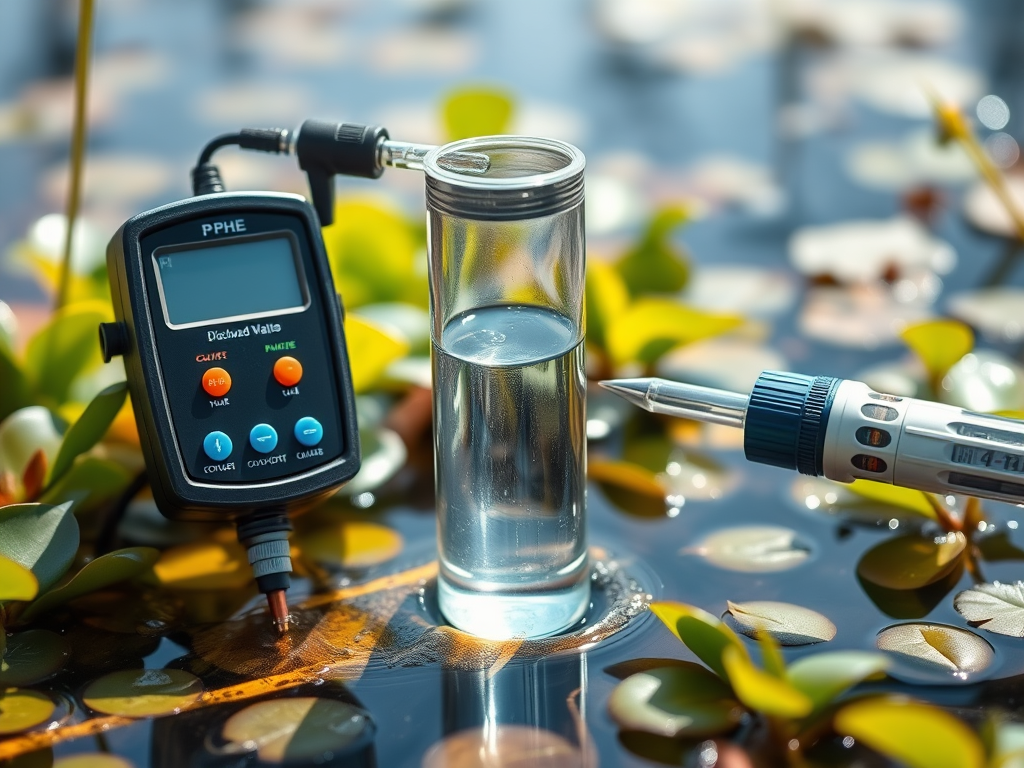
Standard water quality tests can be conducted on drinking water, rivers, and other sites using portable equipment that detects:
- Nitrate and nitrite ions
- Free chlorine
- Chloride and fluoride ions
- Water hardness
- Heavy metals (e.g., lead)
Common water quality indicators for rivers include:
- Biochemical Oxygen Demand (BOD)
- Turbidity
- Ammonia levels
- Dissolved oxygen levels
Two main methods of measuring water quality:
- Direct measures:
- Involve chemical testing of water samples
- Identify concentrations of pollutants or harmful substances
- Examples: nitrates, phosphates, heavy metals
- Known as chemical indicators of water quality
- Indirect measures:
- Involve studying the aquatic organisms (fish, insects, invertebrates)
- High biodiversity indicates good water quality
- Lack of aquatic life suggests poor water quality
- Known as biological indicators of water quality
Summary of measures:
| Indicator | Method | What the Results Show |
|---|---|---|
| Dissolved Oxygen | – Meter and probe or specialized chemical testing kit – Measured as percentage saturation – Bacteria use oxygen to break down organic pollutants | – 75% saturation = healthy, clean water – 10–50% = polluted water – <10% = raw sewage – Low oxygen = potential pollution (e.g., raw sewage) – Impacts aquatic life and food supply |
| pH | – pH probe, pH meter, or indicator paper/test strips – Compare to a color chart – Record the pH value (e.g., 8) | – pH 1–6 = acidic – pH 7 = neutral – pH 8–14 = alkaline – Changes may occur over long periods and may not link to a single source |
| Phosphate | – Test kit – Follow instructions – Measured in mg/dm³ | – < 5 mg/dm³ = clean water – 15–20 mg/dm³ = polluted water |
| Nitrate | – Test strips or test kit – Follow instructions – Measured in mg/dm³ | – 4–5 mg/dm³ = clean water – 6–15 mg/dm³ = polluted water – Over 50 ppm unsafe for drinking – May originate from fertilizers or manure – Contributes to eutrophication |
| Salt (Chloride) | – Test kit, meter, or sensor – Follow instructions – Measured in mg/dm³ | – 20,000 mg/dm³ = seawater – 100–20,000 mg/dm³ = tidal/brackish water |
| Ammonia | – Test strips or test kit – Follow instructions – Measured in mg/dm³ | – 0.05–1.0 mg/dm³ = clean water – >1–10 mg/dm³ = polluted – 40 mg/dm³ = sewage – Often linked with fertilizers or manure |
| Turbidity | – Secchi disc or turbidity tube – Record depth where disc markings disappear | – High turbidity = high suspended sediment – May indicate organic pollutants – Low visibility depth = dirtier water |
| Temperature | – Measured using a waterproof thermometer | – Lower temperature = more dissolved oxygen – Higher temperature = less dissolved oxygen |
Part 2: Biological Oxygen Demand (BOD)
BOD Methodology
- Collect a known volume of water sample.
- Measure the initial dissolved oxygen level.
- Seal the sample in an airtight container and store in the dark at 20°C for 5 days (darkness prevents photosynthesis from adding extra oxygen).
- Measure the dissolved oxygen level again after 5 days.
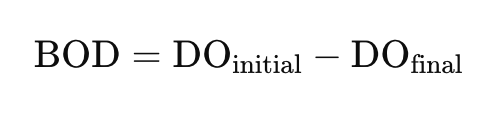
- BOD is calculated as the difference between the initial and final oxygen levels.
BOD Analysis
- Biological Basis:
- Aerobic organisms use oxygen during cellular respiration.
- A higher number of organisms or faster respiration rates at a site leads to increased oxygen use, resulting in a higher BOD.
- Pollution Indicator:
- High BOD levels can indicate organic pollution (e.g., sewage, silage).
- Organic pollutants cause an increase in microorganism populations, which consume more oxygen.
- This can reduce oxygen levels, possibly leading to anaerobic decomposition.
- Anaerobic decomposition may produce harmful gases like methane (CH₄), hydrogen sulfide (H₂S), and ammonia (NH₃).
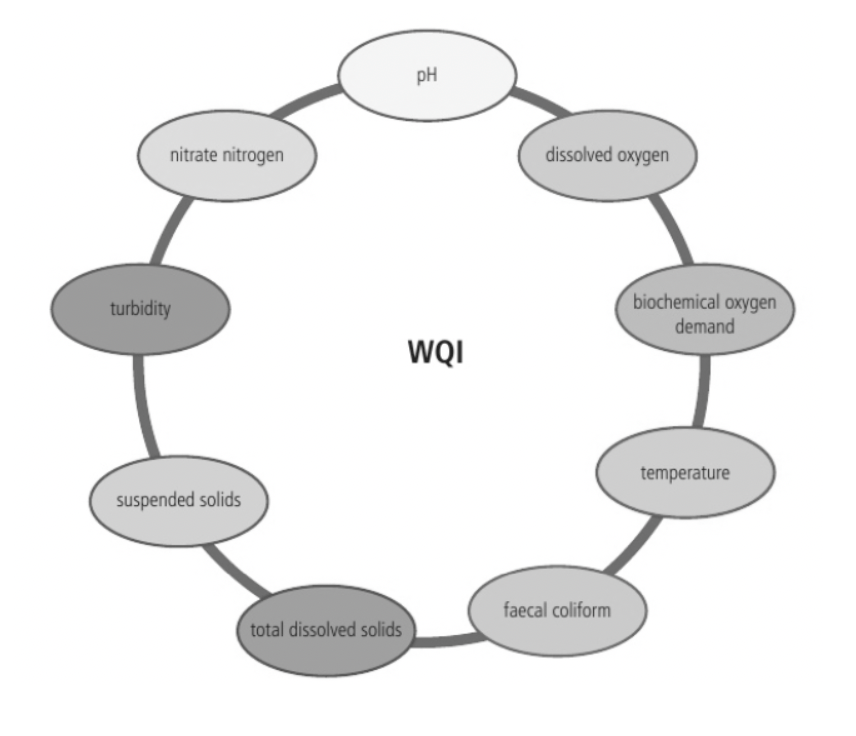
Part 3: [AHL] Water Quality Index (WQI)

- Developed in the 1960s; widely used by water scientists.
- Water quality has declined in many areas, due to both natural causes (e.g. tropical cyclones, El Niño) and human activities (e.g. intensive farming, mining, waste disposal).
- Poor water quality is a global issue affecting both high-income countries (HICs) and low-income countries (LICs).
- Factors such as population growth, improved living standards, and climate change are expected to worsen water quality.
- Common parameters: temperature, turbidity, dissolved oxygen (DO), suspended solids (SS), total dissolved solids (TDS), faecal coliforms (FC), biological oxygen demand (BOD), and nitrate nitrogen.
- Some models exclude suspended solids, microbiological contaminants, and toxic compounds due to high testing costs and limited lab access.
Drinking Water Standards
- No universal national standards exist for drinking water.
- WHO provides guidelines; local governments set their own standards.
- Standards typically target levels of fluoride, lead, nitrates, and selenium.
- Few countries enforce legal standards—exceptions include:
- The European Drinking Water Directive.
- The Safe Drinking Water Act (USA).
| Parameter | WHO | European Union | USA | Canada | India |
|---|---|---|---|---|---|
| Fluoride | 1.5 mg/l | 1.5 mg/l | 4 mg/l | No standard | 1.0 mg/l |
| Lead | No standard | 10 µg/l | 15 µg/l | 10 µg/l | 0.5 µg/l |
| Nitrate | 50 mg/l | 50 mg/l | 10 mg/l | No standard | 45 mg/l |
| Selenium | 40 µg/l | 10 µg/l | 50 µg/l | 10 µg/l | 0.01 µg/l |

![ESS 8.1.3 [AHL] Biocapacity and Environmental Migration](https://mypytrclass.com/wp-content/uploads/2025/12/image-4.png?w=1024)


![ESS 8.3.4 [AHL] Photochemical Smogs and Tropospheric Ozone](https://mypytrclass.com/wp-content/uploads/2025/12/image-1.png?w=1024)