
Learning Objectives
- Outline how births and immigration represent inputs that contribute to the growth of a human population.
- Outline how deaths and emigration function as outputs that reduce the size of a human population.
- Describe population dynamics as measured and analysed using indicators such as total fertility rate, life expectancy, doubling time, and natural increase.
- Outline how the global human population has historically followed a pattern of rapid growth, and predictive models are used to estimate future population trends.
- Describe how human population growth can also be managed indirectly through economic, social, health, development and other policies that have an impact on births, deaths or migration.
Demographic Indicators and Population Dynamics
Demographic Indicators
Various quantitative indicators are employed to evaluate human populations. The human population may be conceptualised as a system which, like all systems, is characterised by inputs and outputs.

Inputs to the system include fertility, birth rates, and migration. The fertility rate is defined as the number of births per thousand women of child-bearing age (typically 15–44 years). At present, the global average fertility rate is approximately 2.3 children per woman, representing a reduction of about 50 per cent over the past five decades. Fertility rates within a country do not incorporate migration data and differ conceptually from birth rates, although the two measures are closely related. The crude birth rate (CBR) refers to the number of births per 1,000 individuals, or per hundred (as a percentage), in the total population, irrespective of age or sex. Unlike the fertility rate, the CBR includes males and individuals outside child-bearing age. Both fertility rates and CBRs may be calculated at global, regional, or local scales. In addition, the immigration rate represents the number of individuals entering a country or region to establish permanent or semi-permanent residence, excluding short-term visits such as tourism.
Outputs from the system consist primarily of mortality and out-migration. The crude death rate (CDR), analogous to the CBR, is expressed as the number of deaths per 1,000 individuals, or per hundred (as a percentage), of the total population, regardless of age or gender. This measure can likewise be calculated at global, regional, or local levels. The emigration rate denotes the number of people leaving a country or region on a permanent or semi-permanent basis.
Population Dynamics
The fundamental measures used to assess human populations are also applied to evaluate population size and patterns of change over time. These basic indicators are employed in the calculation of the natural increase rate (NIR) and doubling time (DT). More specific measures, such as total fertility rate (TFR) and life expectancy (LE), further contribute to an understanding of population dynamics.
The TFR is associated with a critical threshold known as replacement fertility. This value, conventionally set at 2.1 children per woman, represents the average number of children required for a population to maintain zero growth in the absence of migration. When the TFR exceeds 2.1, population growth occurs; when it falls below this level, population decline is expected. The value of 2.1 reflects an average, accounting for the fact that some individuals have no children while others have several. In practice, replacement fertility is closer to 1.75 in most high-income countries (HICs) and many low-income countries (LICs). By contrast, many African countries exhibit TFRs above 3.5, largely due to higher infant and child mortality rates, as well as cultural and societal factors influencing family size.
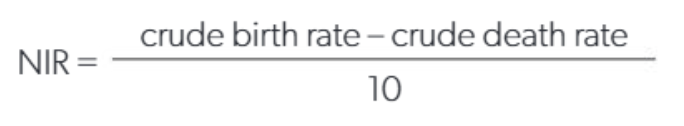
The natural increase rate (NIR) is calculated as the difference between the crude birth rate and the crude death rate, divided by ten. Dividing by ten is necessary in order to express the result as a percentage. Accurate calculation of the NIR is essential, as it is subsequently used to determine a population’s doubling time.
The doubling time (DT) of a population is calculated by dividing 70 by the natural increase rate. This provides an estimate of the number of years required for a population to double in size, assuming the growth rate remains constant.
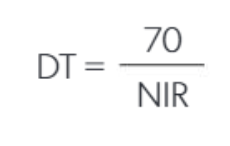
Applying these calculations illustrates the implications of different growth rates. A population with an NIR of 1 per cent will double in size in approximately 70 years. By contrast, a population with an NIR of 2 per cent will double in around 35 years. Natural increase rates of this magnitude are relatively common, particularly in many African countries.
Summary of Terminologies
| Category | Measure | Definition |
| Demographic indicator | Crude birth rate (CBR) | The number of live births per 1,000 individuals in a population per year. |
| Immigration rate | The number of immigrants entering a population per 1,000 individuals per year. | |
| Crude death rate (CDR) | The number of deaths per 1,000 individuals in a population per year. | |
| Emigration rate | The number of emigrants leaving a population per 1,000 individuals per year. | |
| Population demographic dynamic | Natural increase rate (NIR) | The rate of population growth expressed as a percentage per year, calculated from birth and death rates and excluding migration. |
| Doubling time (DT) | The number of years required for a population to double in size, assuming a constant growth rate. | |
| Total fertility rate (TFR) | The average number of children a woman is expected to have over her lifetime. | |
| Life expectancy (LE) | The average number of years a person can be expected to live, based on current mortality patterns. |
Human Population Growth
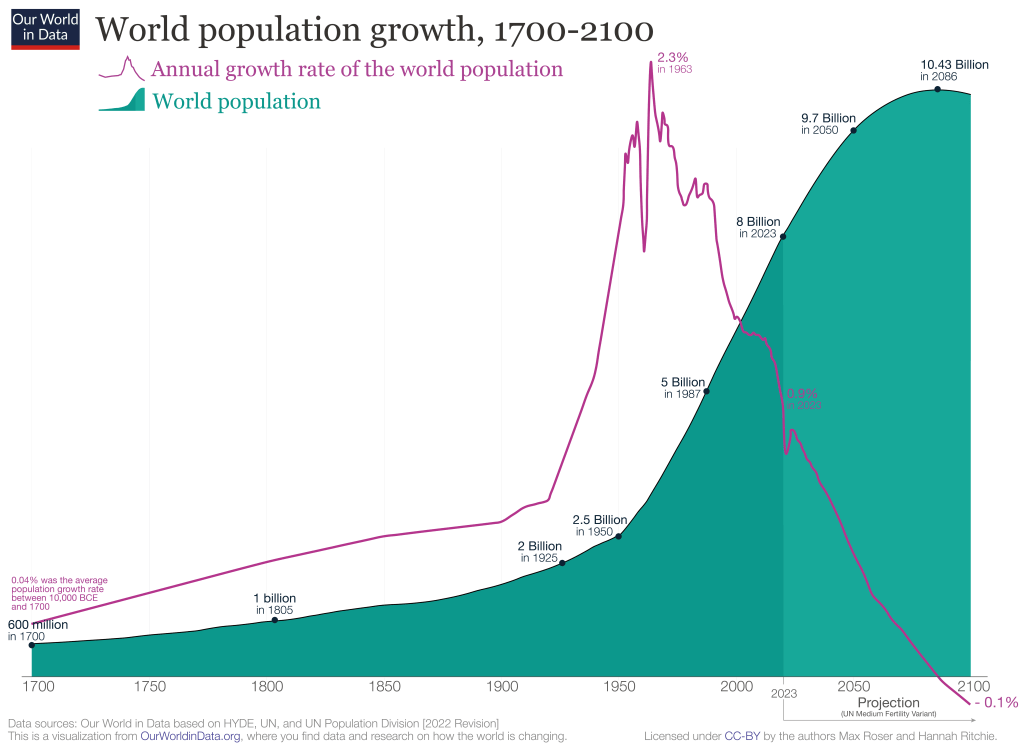
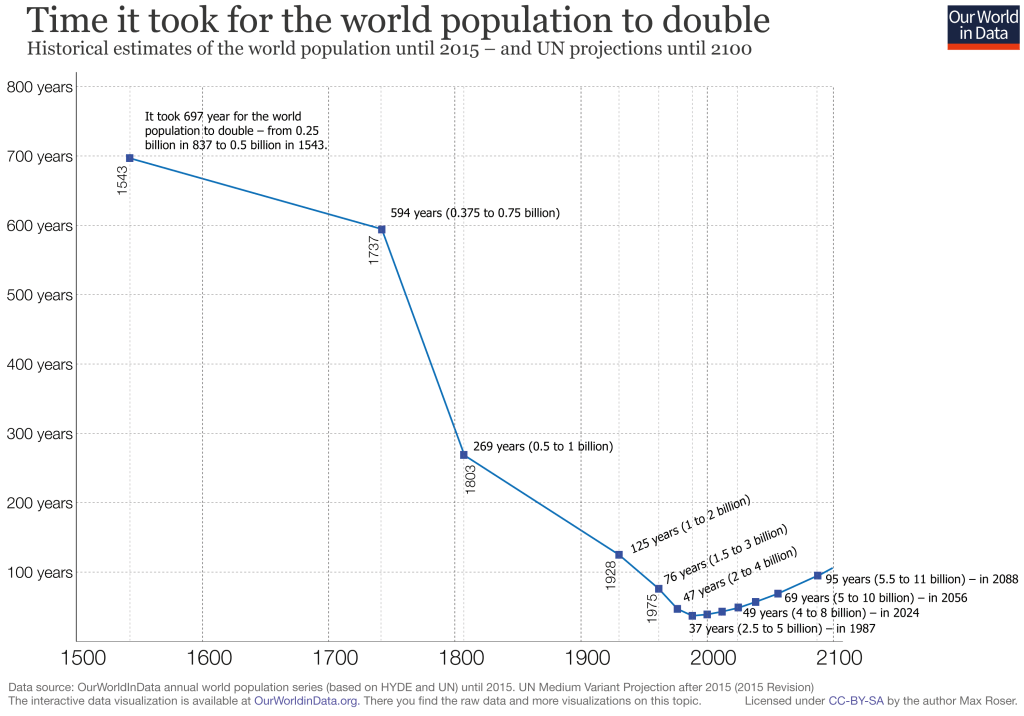
Human population growth has accelerated markedly over the past three centuries, with the majority of this increase occurring in relatively recent history. The global population doubled from approximately 1 billion to 2 billion between 1804 and 1922, and doubled again to 4 billion between 1922 and 1974. It was subsequently projected to double once more to 8 billion by 2028. These trends indicate a progressive reduction in the time required for the population to double, although the overall rate of growth has begun to slow since 1999. Currently, up to 95 per cent of global population growth occurs in low- and middle-income countries (LICs and MICs). Despite this, the world’s population is expected to stabilise at around 8.5 billion following a peak of approximately 11 billion.
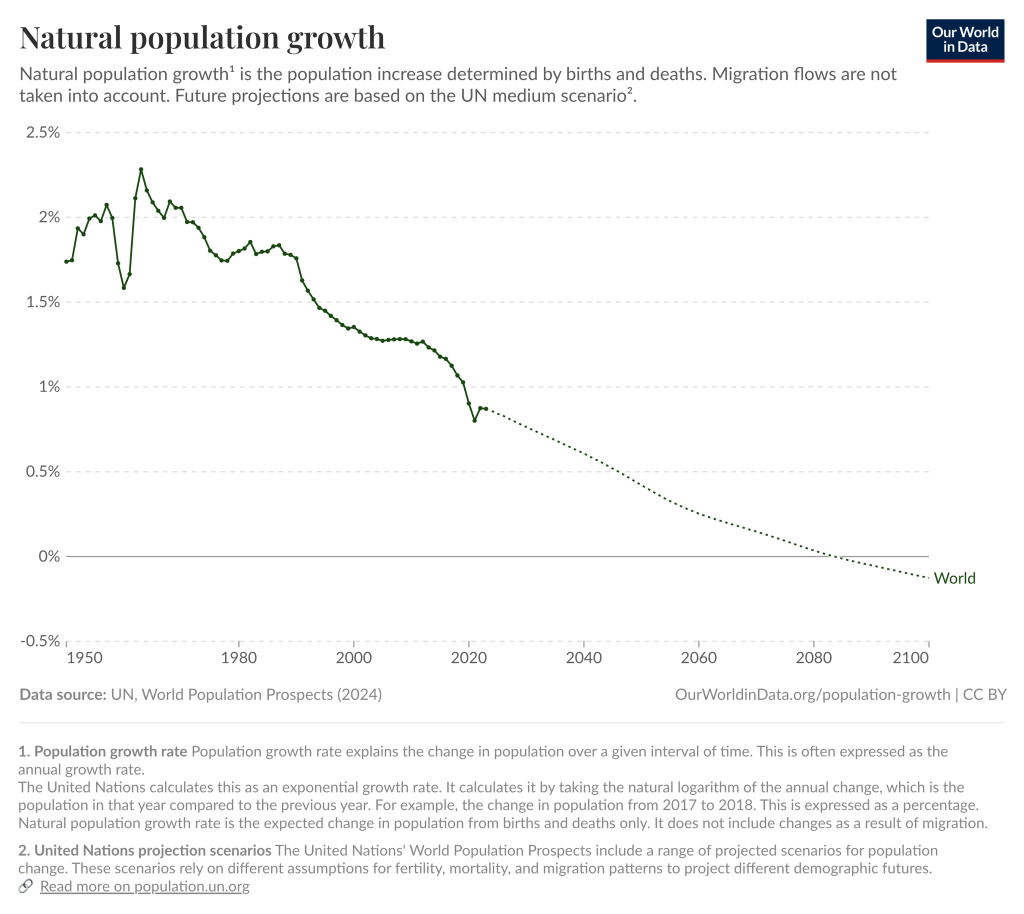
In 1990, women worldwide gave birth to an average of 3.3 children over their lifetimes. By 2002, this figure had declined to 2.6, and by 2020 it had fallen further to 2.42, only marginally above the level required for population replacement. If these trends persist, global fertility is projected to fall below replacement level before 2050. Population projections also indicate that the HIV/AIDS epidemic, which has caused more than 40 million deaths over the past four decades, has reduced life expectancy at birth in several countries. The impact of AIDS has been most pronounced in developing regions of Asia, Latin America, and particularly sub-Saharan Africa. Countries such as Botswana and South Africa may experience population decline as a result of AIDS-related mortality. In addition, global deaths attributed to COVID-19 are estimated at approximately 7 million. Overall, global population growth curves indicate a gradual deceleration in growth rates.
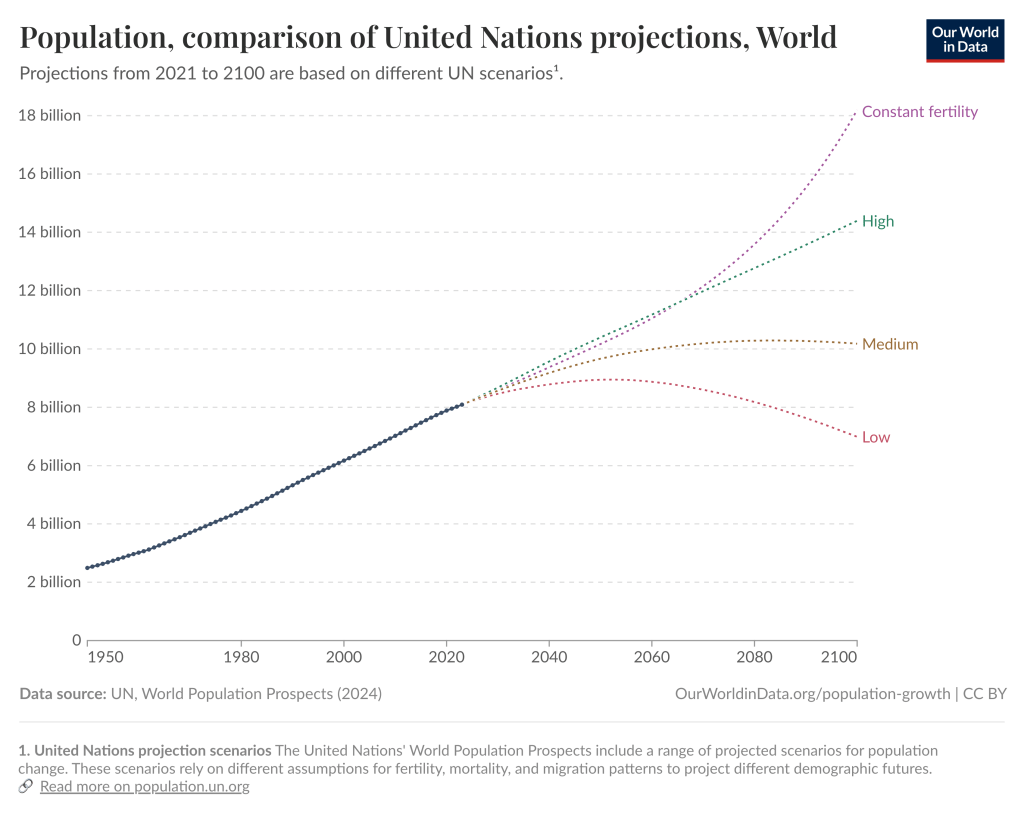
Long-term population projection models are subject to considerable uncertainty, especially in countries with high fertility rates. Population projections produced by organisations such as the United Nations, the Institute for Health Metrics and Evaluation, and the Joint Research Centre of the European Commission compare long-term global population trajectories between 2022 and 2100 under a range of scenarios. These projections suggest a 95 per cent probability that the global population will fall between 9.4 and 10.0 billion by 2050, and between 8.9 and 12.4 billion by 2100. Consequently, while the global population is almost certain to continue increasing over the coming decades, the degree of uncertainty associated with long-term projections also increases. This growing uncertainty is reflected in the widening prediction intervals for projected numbers of births and total population size. United Nations projection models to 2100 vary by approximately 7 billion, ranging from a low estimate of about 7 billion to a high estimate of around 14 billion, with a medium projection of approximately 10 billion.
Human Population Indirect Management
Gender Equality
Gender equality has a significant influence on reducing birth and fertility rates. In countries where women participate extensively in the workforce, fertility levels tend to be low, a pattern that is also evident at sub-national scales. For example, within India, the state of Kerala exhibits the highest levels of gender equality and correspondingly low fertility rates compared with other states. By contrast, in societies where female labour force participation is limited, fertility rates generally remain high. Where women are able to exercise autonomy over reproductive decisions, including the number of children they have, birth rates tend to decline.
Level of Education
Educational attainment is another key determinant of fertility. In societies where girls have equal access to education, such as Norway, Sweden, and Germany, fertility rates are typically low. Conversely, in countries where educational opportunities for girls are restricted, such as Afghanistan, fertility rates remain high. More broadly, higher levels of parental education are associated with smaller family sizes. Households with limited financial resources often have larger families, while more affluent households may be able to support larger families but frequently choose not to do so. Middle-income families with high aspirations but constrained resources tend to have the smallest families, as they seek to improve their standard of living by limiting family size. Furthermore, individuals with higher educational qualifications often secure better-paid employment and may prioritise material well-being or career advancement over larger families.
Economic Factors
Economic conditions also play a central role in shaping fertility patterns. Periods of economic prosperity are generally associated with higher birth rates, whereas rising living costs, economic recession, and unemployment tend to suppress fertility due to the expense of raising children. Research suggests that the cost of raising a child in the United States can exceed US$240,000, partly due to lost earnings, particularly for mothers. In response, some governments, including those of France and Russia, provide financial incentives to support families with children. Whether these costs are objectively real or subjectively perceived is of limited importance; if prospective parents believe that they cannot afford to raise children, or that additional children would reduce their standard of living, they are less likely to have them. At the global scale, a strong relationship exists between fertility and levels of economic development. The United Nations and numerous non-governmental organisations argue that sustained reductions in high fertility rates in low- and middle-income countries can only be achieved through improvements in overall living standards.
Social factors – the need for children
Social factors, including the perceived need for children, also influence fertility decisions. In agricultural societies, larger families are often valued as a source of labour and as a form of security for parents in old age. This rationale is less prevalent in middle-income countries, where fewer households rely on farming, although family-based care for elderly relatives remains common. Urbanisation has had a particularly significant effect on birth rates. In 1960, approximately one-third of the global population resided in urban areas, a figure that has since risen to over half. While children may represent an economic asset in rural farming contexts, in urban environments larger families increase household costs. Urban women are also more likely to have access to education, employment opportunities, and contraception, all of which contribute to lower fertility rates. In very poor countries, high infant mortality can increase pressure on women to have more children in order to compensate for early deaths; such births are often described as replacement or compensatory births.
The impact of disease
Patterns of disease and health transition further shape population dynamics. As countries develop, mortality from infectious diseases such as measles, cholera, and tuberculosis declines, largely as a result of improvements in public health, sanitation, housing quality, and nutrition. At the same time, mortality from non-communicable diseases, including cardiovascular disease, cancer, and stroke, increases as populations live longer and are more exposed to degenerative conditions.
The COVID-19 pandemic has also had a substantial impact on population growth by reducing both fertility and migration rates. In many high-income countries, births are typically planned, and decisions to have children depend heavily on expectations about future economic and social stability. During the pandemic, widespread uncertainty reduced optimism, leading to delayed or foregone childbearing. For example, the Brookings Institution estimated that approximately 300,000 fewer births occurred in the United States during the pandemic due to economic insecurity. Migration patterns were similarly disrupted: in 2020, Australia experienced its first population decline since the First World War as a result of strict border controls, while Canada granted permanent residency to around 180,000 people, well below its target of 381,000. In the United States, COVID-19-related mortality contributed to a reduction in life expectancy of approximately two years for African Americans and three years for Latin Americans. Globally, deaths attributable to COVID-19 were estimated at between six and seven million by February 2024, although these figures remain subject to uncertainty due to variations in data quality and reporting practices.
Notes and Exercises
Notes
Activity
Download the following activity sheet and complete it
![ESS 8.1.3 [AHL] Biocapacity and Environmental Migration](https://mypytrclass.com/wp-content/uploads/2025/12/image-4.png?w=1024)


![ESS 8.3.4 [AHL] Photochemical Smogs and Tropospheric Ozone](https://mypytrclass.com/wp-content/uploads/2025/12/image-1.png?w=1024)