

Learning Objectives
- Describe the management of human population by pro-natalist and anti-natalist policies using named examples
- Outline the use of population pyramids
- Describe DTM
Direct Policies in Managing Human Population
Population and migration policies may be employed to directly manage rates of human population growth. Such policies may be anti-natalist or pro-natalist, explicitly targeting birth rates, or they may focus on regulating immigration and emigration. A wide range of cultural, religious, economic, social, and political factors may be utilised in the design and implementation of these policies. Population and migration policies are often introduced to achieve specific objectives, such as expanding the labour force or limiting population growth.
National population policies refer to formal government interventions intended to influence population size or structure. Pro-natalist policies are designed to encourage higher birth rates, whereas anti-natalist policies seek to reduce fertility levels. The effectiveness of population policies varies according to national context and implementation strategies.
In many low- and middle-income countries (LICs and MICs), including The Gambia, governments have introduced programmes aimed at lowering birth rates. The success of such initiatives depends on several factors, including an emphasis on comprehensive family planning rather than solely on birth control, adequate financial investment, and meaningful consultation with local communities. Where birth control measures have been imposed coercively by governments, outcomes have generally been less successful. In contrast, high-income countries (HICs) often provide financial and social support for families and children as part of pro-natalist strategies. In countries experiencing concerns over declining population growth, governments are increasingly adopting more direct and active measures to stimulate fertility.
Given the challenges associated with managing population change through pro- or anti-natalist policies alone, migration policies are also widely used as a tool for population management. In 2017, the number of international migrants—defined as individuals living in a country other than that of their birth—reached nearly 260 million, representing an increase of 85 million, or 49 per cent, since 2000. Economic and social factors, including employment opportunities, higher wages, and improved access to healthcare and education, remain the primary drivers of migration, although political instability and conflict have become increasingly significant.
The United Nations Sustainable Development Goals (UN SDGs), specifically Target 10.7, call upon countries to facilitate orderly, safe, regular, and responsible migration and mobility through well-planned and effectively managed migration policies. According to the United Nations, when supported by appropriate policy frameworks, migration can contribute to inclusive and sustainable economic growth and development. Overall, migration tends to have positive effects on both countries of origin and destination. As migrants are typically of working age, they can help to reduce old-age dependency ratios in host countries.
Globally, most governments aim to maintain current levels of migration. Europe has the highest proportion of countries seeking to increase immigration, at approximately 32 per cent, followed by Asia at 10 per cent. Conversely, Asia also has the largest proportion of countries attempting to reduce immigration levels, at 23 per cent, followed by Africa at 13 per cent. Worldwide, more than two-thirds of governments identify meeting labour demands in specific economic sectors as the primary motivation underlying their migration policies. Some countries, including the United Arab Emirates and Saudi Arabia, rely heavily on migrant labour, particularly in sectors such as agriculture and other forms of manual work that are often unattractive to the local population. In addition, many migrants remit a significant proportion of their earnings to their families in their countries of origin, contributing to household incomes and national economies.
Population Pyramids
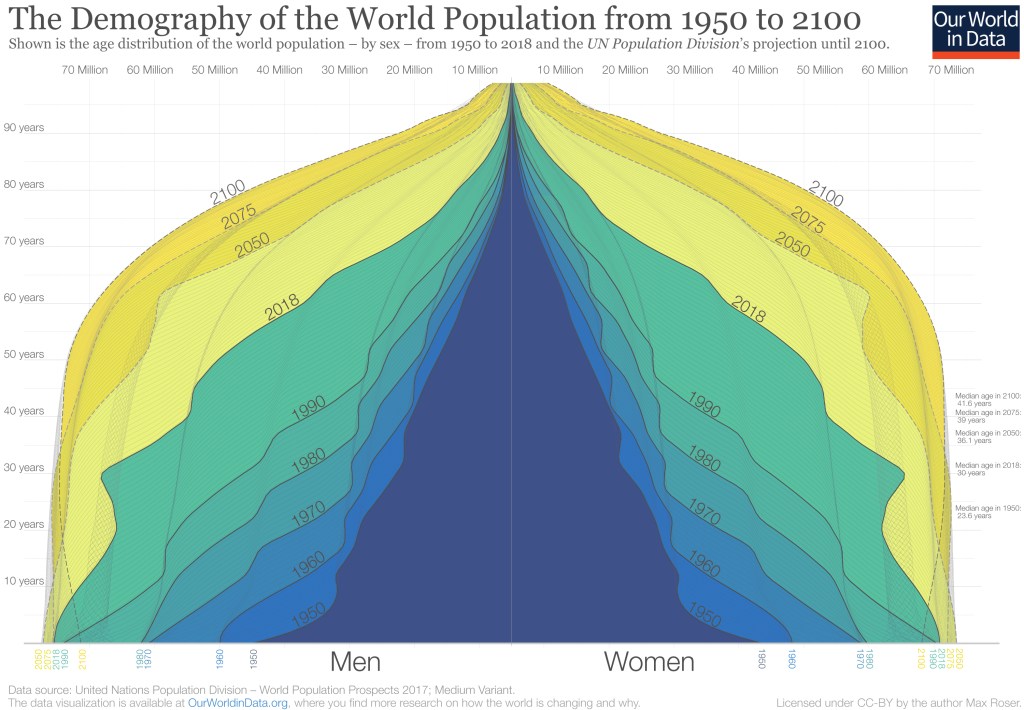
Population pyramids, also known as “age-sex pyramids” or “age-gender pyramids,” are graphical representations used to depict the distribution of a population by age and gender. While they are highly informative, they are not always pyramid-shaped. Population pyramids can take a variety of forms, and there are multiple methods for displaying them. It is important to carefully verify the unit of measurement for the population along the X-axis.
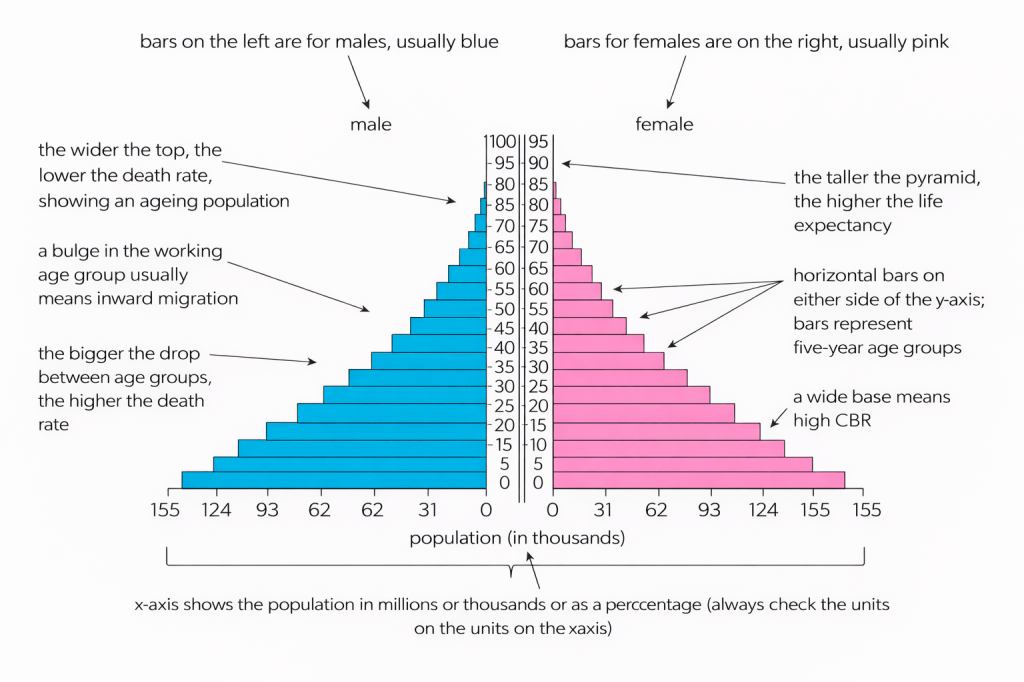
Key informations that can be obtained from population pyramids are:
- A broad base signifies a high birth rate
- Narrowing base (where the number or proportion of 0–4-year-olds is smaller than that of 5–9-year-olds) indicates a declining birth rate.
- Vertical or near-vertical sides are indicative of a low death rate
- Concave slopes reflect a high death rate
- Bulges within the slopes may reflect periods of baby booms or elevated rates of immigration or in-migration;
- For example, a large number of males aged 20–35 may represent economic migrants seeking employment, while a high number of elderly, typically female, residents may indicate populations concentrated in retirement areas.
- Notches or “slices” in the slope suggest emigration, out-migration, or age- or gender-specific mortality resulting from epidemics or periods of conflict.
- The total population, or the percentage of the total population within each age cohort, is displayed alongside each bar.
Population Policies in Singapore: Anti-natalist and Pro-natalist Approaches
Singapore has implemented both anti-natalist and pro-natalist population policies at different periods, reflecting the changing demographic and socio-economic context of the city-state. Between 1972 and 1987, the government pursued an anti-natalist agenda under the slogan “Stop at Two.” Measures included the establishment of the Family Planning and Population Board (FPPB), provision of low-cost contraception, the creation of family planning clinics with easy access, media campaigns promoting smaller families, free education and affordable healthcare for small families, and the promotion of sterilisation. The population pyramids for 1970 and 1980 demonstrate the policy’s impact, with a narrowing base indicating a reduction in birth rates. The success of such anti-natalist policies can be attributed to women’s increased control over fertility, changing attitudes toward family size, business support due to reduced maternity costs, and urbanisation, which made smaller families more practical and desirable.
Following the success of these measures, Singapore faced the challenges of a shrinking population and an ageing demographic. In 1987, the government introduced pro-natalist policies under the slogan “Have three or more if you can afford it.” These strategies included extending maternity leave to 12 weeks for the first four children, increasing child benefits, providing subsidised childcare, establishing government-sponsored dating agencies, discouraging sterilisation and abortion, eliminating the FPPB, and offering enhanced child benefits for parents with higher education. However, pro-natalist policies generally proved less effective. Factors contributing to this include women’s reluctance to return to larger family sizes once reproductive autonomy is established, limited government influence over personal decisions in democratic high-income countries, public perceptions of government intrusion, and potential challenges for businesses in supporting extended maternity leave, which may result in workplace discrimination against women.
Russia’s Pro-natalist Policy
Russia has experienced low fertility for several decades, driven by factors such as an ageing population structure, women opting for smaller families, challenges in reproductive healthcare, high divorce rates, and infertility. Both the Soviet Union and the Russian Federation have historically implemented pro-natalist policies. These initiatives began in 1936, rewarding families for having a third or fourth child, and later providing incentives for having a second child. Between 1941 and 1990, a tax was imposed on childless individuals.
During the 1970s, fertility rates in Russia fell slightly below the replacement level, prompting renewed pro-natalist measures in 1981. However, analyses indicate that these policies primarily lowered the age at childbearing rather than increasing overall fertility. By 2006, the total fertility rate (TFR) had declined to below 1.3 births per woman. In response, President Vladimir Putin introduced further measures to encourage childbirth, including:
- Enhanced pregnancy, birth, and child benefits based on family size.
- Extended parental leave following childbirth.
- Increased payments to mothers of second and third children, reaching approximately US$12,500 in 2012.
The government also considered reintroducing a tax on childlessness.
Between 2006 and 2011, these measures coincided with a 21% increase in fertility, with births of second and third children rising by 40% and 60%, respectively. Nevertheless, these gains were limited, as the increases stemmed from a very low baseline and proved less effective than the 1981 reforms. Evaluations suggest that the effects diminished over time; after five years, women’s intentions to have additional children had changed little. While families tended to have children earlier, the total number of children per family did not increase substantially.
In May 2012, President Putin set a target TFR of 1.75 by 2018. By 2022, Russia’s TFR was 1.6. Demographers argue that further improvements would require significantly greater state financial support or an increase in immigration, although public resistance to immigration is strong. Consequently, Russia’s population decline is expected to continue, with TFR likely to remain below the replacement level (2.1) for the next two decades. As the population ages, the number of individuals entering childbearing age is projected to be approximately 20% lower than the current cohort. Estimates suggest that Russia’s population in 2100 could be comparable to that of 1950, around 100 million. The workforce is predicted to decline by approximately 15% by 2024, a trend that could be partially mitigated by raising the retirement age.
In 2020, President Putin announced plans to raise the average TFR to 1.7 by 2024, including expanded tax incentives for larger families. The ‘maternity capital’ program, previously limited to families with at least two children, was also extended. However, these measures are unlikely to have a major impact, as declining fertility trends are occurring across industrialized nations, including wealthier countries.
Activity
Complete the following activity sheet
Demographic Transition Model, DTM
Summary of each stage
| Stage | Name | Birth Rate | Death Rate | Population Change | Key Features / Examples |
|---|---|---|---|---|---|
| Stage 1 | High and Variable | High and fluctuating | High and fluctuating | Very slow or unstable growth | No modern countries; some isolated tribes; UK until ~1750 |
| Stage 2 | Early Expanding | High | Rapidly falling | Very rapid growth | Improved healthcare, sanitation, and food supply; Afghanistan, Sudan; UK by ~1850 |
| Stage 3 | Late Expanding | Falling | Low | Growth slows | Family planning, urbanisation, education; Brazil, Argentina; UK ~1950 |
| Stage 4 | Low and Variable | Low | Low | Stable or slow growth | Most developed countries, including the UK |
| Stage 5 | Declining | Very low (below death rate) | Low | Population decline | Ageing population; Japan, Sweden |
Reasons for Birth and Death Rates
| Category | Reasons |
|---|---|
| High Birth Rates | • Children needed for farm and manual labour • Support parents in old age • Continue family name • Social status and prestige • High infant mortality leads to replacement children |
| High Death Rates | • Lack of clean water • Food shortages • Poor sanitation and hygiene • Overcrowding • Infectious diseases • Poverty and limited healthcare |
| Low Birth Rates | • Children are expensive • Government pensions and healthcare • More women in education and careers • Widespread contraception • Lower infant mortality |
| Low Death Rates | • Clean water supply • Reliable food supply • Improved sanitation and hygiene • Better healthcare and vaccinations • Higher standards of living |
![ESS 8.1.3 [AHL] Biocapacity and Environmental Migration](https://mypytrclass.com/wp-content/uploads/2025/12/image-4.png?w=1024)


![ESS 8.3.4 [AHL] Photochemical Smogs and Tropospheric Ozone](https://mypytrclass.com/wp-content/uploads/2025/12/image-1.png?w=1024)